v5.19
TAS 5.19 brings three major themes. Users work faster, with an AI assistant that knows their cases and company documents. Administrators stay on top of operations: the new System Health page, redesigned crons and database maintenance flag problems before users notice them. And TAS now connects to the AI tools people in your company already use.
💼 For users
An AI assistant that knows your cases and documents
The AI assistant in TAS no longer just answers general questions. It works directly with your cases, documents and your organization’s internal know-how.
- Creating and editing cases. The assistant creates a new case or edits a running one, including dynamic rows. It fills in values according to how the template is actually configured. Whatever it can’t fill in, it leaves empty for you.
- Case analysis. The assistant summarizes where a case stands and what needs to be done, without you having to go through its history.
- Questions about documents. You can ask about a 40-page contract, for example about deadlines or penalties, and the assistant answers directly from the attached file.
- Company know-how in one place. The assistant draws primarily on your organization’s internal AI documents (policies, benefits, internal procedures) and distinguishes them from the TAS product documentation. Its answers include citations, so you know where the information comes from.
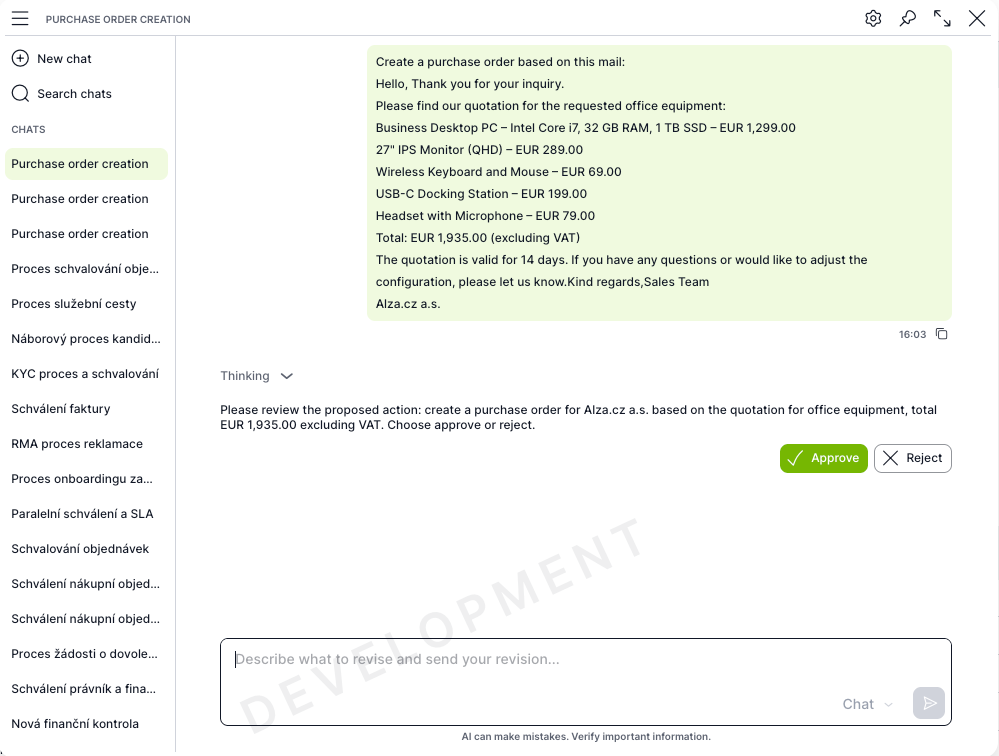
Conversations are easier to navigate:
- Real-time responses and persistent conversation memory.
- Milestone bar. In conversations with five or more questions, a list of your messages appears next to the thread, so you can quickly jump back to an earlier question.
- Collapsible thinking. The assistant’s steps are listed as it works on the answer and collapse under a toggle once it’s done.
- Conversation search and automatic naming of new conversations based on the first question.
- One-click confirmation. You approve or reject the changes the assistant makes with a single click on the action card.
Case diagram with drill-down into history
The case diagram now shows not only the shape of the process but also what actually happened in it. Each node holds all of its task instances and completed executions. A clickable counter on the node opens a list of the individual runs with the solver, status, dates and note. Statuses are color-coded, including a separate status for a waiting task that has no solver yet.
The diagram is built from the current version of the template. That’s why nodes carry an origin tag (in both, case only, template only), so you can tell at a glance whether the template has changed since the case was created.
A snappier app, every day
The modern part of the application has undergone extensive rendering optimization. Overviews, cards, grids, editors and task detail tabs load only when they’re actually needed. Screens appear faster, and case and task details respond more smoothly.
Document previews
Files in a case have thumbnails, so you can recognize the right document without opening it. An uploaded document appears in the Case Overview immediately, with all its details: upload date, user and the source variable tag.
Overviews and grids
- Overviews and grids can be displayed in landscape and full-screen mode.
- Clicking the default column toggles the sort direction (ascending / descending). A third click on another column restores the table’s default sort order.
- Excel and CSV exports are named after the data source.
- Redesigned system notifications.
🛠️ For administrators
System Health: spot problems before they happen
Administration → System Health replaces the former Appstatus page. The system status is made up of individual probes:
- application, database and database activity,
- Elasticsearch, Redis, Tika, LibreOffice,
- email and Firebase,
- crons,
- host resources, including disk space,
- business KPIs.
The probes are aggregated into a single green / yellow / red indicator. A 48-hour history is kept even when nobody has the page open. Each component’s card shows its main metric with a small chart, and clicking it opens the metric history with the warning and critical thresholds marked.
- Multiple backends. Each instance is sampled independently and labeled as Web or Cron worker. You can switch between instances, and each one has its own aggregated status.
- Database activity. Running queries; open, idle and blocked transactions; the database server version; and the option to cancel a long-running query.
- Dashboard. You can add a System health container to the Dashboard, showing either a status summary or selected components with live charts.
Cron management: overview, monitoring and alerts
Cron management has been completely redesigned. Administrators create crons themselves from a catalog of available crons. Each cron has an editable display name and a fixed technical name. Parameters are entered in a form generated from the cron’s schema, with help text right next to the fields, and they are validated as soon as you save. The application rejects an invalid configuration before the cron ever runs.
The new Monitor tab shows the following for each cron:
- whether it is currently running and since when,
- the next run, calculated from the cron expression,
- the last run, its duration and result,
- the number of consecutive failures, the success rate and the average duration over a selected period,
- the instance and PID of the run, and a color-coded status.
By default, the monitor lists active crons. Each administrator can star their favorite crons to pin them to the top of the list.
Also available:
- run history with drill-down into the logs of a specific run,
- manual runs and activation / deactivation directly from the overview row,
- a Factory settings button,
- email notification after a specified number of consecutive failed runs,
- a heartbeat monitor that automatically alerts you to an overdue cron or a stuck run.
Database maintenance
A new database maintenance service generates an index health report (fragmentation, page count) and a report of the most resource-intensive queries, and it can rebuild fragmented indexes online, meaning without locking the table. It works with both MS SQL Server and PostgreSQL and is available as the DatabaseHealthReportCron and DatabaseIndexRebuildCron crons as well as CLI commands.
Logging and SIEM integration
Logs can be written to a file in NDJSON format and sent via syslog (RFC 5424), both in parallel with the main log backend. If Elasticsearch is unavailable, logs are automatically written to the console as well, so they don’t get lost.
Logs carry context identifiers: case, template, template task, header and cron. This means you can filter the logs of a specific case in the GUI, templates have their own Logs tab, and the cron monitor shows the logs of a single cron as well as of a single run.
TAS right inside Claude, ChatGPT and other AI clients
With the MCP server, you can connect TAS to the AI assistant people in your company already use (for example Claude Desktop or Claude Code). Users can look up a case, create a new one, fill in variables or have the configuration explained to them, all without switching apps.
The connection runs through a single endpoint authenticated with an API token. An optional scenario in the URL limits which tool collections are exposed: case creation, editing, lookup, knowledge, account and administration. Every tool call is recorded in the audit log along with the user, collection and source.
AI template builder: tasks and links in a single conversation
The AI builder no longer designs just variables. In a single conversation, it also designs and imports tasks (type, description, due dates, solver assignment) and workflow graph links (condition trees, priorities, else branch, branching mode).
- Trial run. A dry run takes place before anything is written, revealing problems before any change is made.
- Transactional import. If an error occurs, the whole import is rolled back, so the template is never left half-modified.
- No duplicates. The builder recognizes existing template elements across language versions and asks you instead of creating a duplicate.
AI in administration: oversight and providers
- AI observability. A new administration module with overviews of conversations, workflows, user confirmations, model runs and tool calls.
- Tool collections. Tools are grouped into collections. The assistant first selects a collection and only then a specific tool, which saves context and makes the choice more accurate. Plugins can add their own collections too.
- AI providers. The complete setup (enabling, provider, key, Azure OpenAI) is in the dynamic configuration. Providers compatible with the OpenAI API and locally hosted models via Ollama are supported as well. The temperature,
maxTokensand timeout parameters are applied to model calls. - The Default Platform AI Smart Event uses the system-configured AI with no additional setup.
Plugin Store and plugin configuration from the GUI
The plugins page has a new Plugin Store tab listing plugins compatible with the running TAS version, grouped by category, with search, filtering and sorting. You can install, update (including the “Update all” action and the “Updates only” filter) and uninstall plugins directly from administration, without touching the environment.
Plugins can ship with their own configuration schema, and their settings are then edited in Administration → Configuration → Plugins. The singleSignOn and exposeDb plugins have already been converted this way: their settings have moved from environment variables to the database.
Email integration via MS Graph
Mailbox configuration in the email-processing crons is much clearer:
- Mailboxes are collapsible cards named after their email address, and they can be duplicated.
- The user, process template and group header are selected from an autocomplete instead of entering numeric IDs.
clientSecretcan reference a secret stored in the Vault in the form{{vault:name}}.- The Discover folders button browses the mailbox structure live via Microsoft Graph and inserts the selected folder’s ID straight into the configuration. No more looking up folder IDs by hand.
- Field mapping is a free-form key / value list, so you can add any target variables to it.
TAS also sends emails via MS Graph (as an alternative to SMTP) and reads custom X-* headers into process variables. For the Service Console, the sys.msGraphListAllMailboxesFolderInfo() function returns the folders and subfolders of all configured mailboxes in a single call.
Vault: certificates and keys
- Key pair generation (RSA / ECDSA, PEM / JWK) directly in administration. The private key stays hidden, and the public key is saved among the certificates.
- New Certificates tab: certificates are stored encrypted in the database with X.509 metadata, and a cron monitors their expiration both on disk and in the database.
- A Smart Event for signing short-lived JWT tokens with a key from the Vault.
- Vault secrets can also be referenced in the MS Graph cron configuration and in the
jwt.sign()andjwt.verify()functions. - Locking a user takes effect immediately across all of their sessions, including the mobile app and API tokens.
Templates and process definitions
- Importing variable assignments from another task, optionally including dynamic conditions. The application asks before overwriting a non-empty assignment.
- Creating a variable from a modal directly in the variable assignment builder and in calculations.
- Dynamic conditions now support
getDynTable, fetching user information and functions for cached calls. - Field tooltips in template settings, and a Logs tab filtered to the given template.
- Template export and import now include Case Overview sections, script mapping and the TAS version. Older exports can still be imported.
- Stricter validation of variable definitions. The application rejects any property that doesn’t belong to the given variable type.
- Task link conditions. The “mandatory link” flag has been removed; task activation is now governed solely by the node’s inputs.
- Manual events directly from the graph. The event is created automatically in the background with the
TTASK_IDprefix and the name entered in the task. You no longer need to create the event separately and then connect it in the graph.
Mapping scripts to prints, Case Overviews and dynamic conditions
Prints, Case Overviews and task dynamic conditions can each choose which frontend scripts to load. On installations with dozens of scripts, this speeds up the loading of prints, overviews and task forms; an error in one script doesn’t affect the others; and you can see which scripts a given print or set of conditions relies on. The mapping is carried over on template export and import, and a deleted script is removed from the mapping automatically.
Variable alias management
Administrators manage template variable aliases directly in the variables grid: they can assign a free alias, remove it, or take over the alias of another variable of the same kind. The application doesn’t allow an alias to be removed or taken over while the variable is used by a column or filter in any overview.
The Alias candidates analysis shows aliases held by variables that no case, history or overview uses; these aliases can most likely be released.
Calculations and scripts
New functions:
lib.getUsers,lib.getRolesandlib.getOrgUnits: structured queries on users, roles and the organizational structure, with filters, sorting and paging. Instead of loading all users and filtering them in the calculation, you can search directly by part of a value.storage.moveDmsFilesToCaseandstorage.moveDmsFilesFromCase: move documents between cases, including revisions, tags and the full-text index, with an entry written to the history of both cases.docxGenerator.generate(...): generates a document from a template, optionally saving a PDF copy to the DMS.- Axios supports client certificates (mTLS) and optional
ciphersfor counterparties with older certificate signatures. The default timeout is 120 s, so a calculation doesn’t hang.
Modernized administration screens
More pages have moved to the modern interface: Scripts and script detail, Service Console, Authentication methods, DMS attributes, Scheduled tasks, Crons, Events and event rules, CSV, Email queue, Migrations, Visual identity, Template print, Import models and statuses, the case graph and the 404 error page. Besides a new look, they bring faster work with grids and consistent modals.
Other improvements
- Shared files (assets) as a new administration section.
- License management. A grid with license ID, note, issuer and validity, a filter for active licenses, deletion, license key validation before saving and support for multiple hostnames in a single key. After a license is added or removed, the application reloads so the change takes effect right away.
- The Service Console renders HTML responses and displays nested objects in the result table.
We’ll be happy to plan your upgrade to version 5.19 with you. Get in touch with your Neit consultant.