User guide
Quick Start Guide
Case notes
Table component
FAQ
Search
Dashboard
Deleted Documents and Access Log
Solving a task
AI Assistant
Manuals
Substitution and Vacation
Suspending, resuming, archiving and deleting a case
Case variables, history and graph
Basic Terms
Uploading Documents, Folders and Revisions
News
Favorites
Navigating the interface
Dashboard widgets
Case Detail
News/Announcements in Team assistant
Case list
Logging In and Out
Account Settings
Task List
Mobile app settings
Reports and Charts
Searching and Listing Documents
Handing Over, Taking Over and Tasks to Pull
Bulk Tasks
Printing a Case
Creating and Editing an Overview
What Is TAS
Form Fields
Tablet Interface and NFC
Overviews
Creating a New Case
Case Events
Case Permissions
Subscribing to an overview by email
Administrator Guide
Platform guide
Administration
Crons
Authentication and Synchronization
SMTP OAuth authentication
LDAP, SAML, Entra ID and NFC: Settings
Configuring authentication modules
Authentication
Vault
DMS attributes
Service Operations
Mobile App Setup for Your Environment
Scheme
XML Process Import
HR agenda and agenda handover
Logs
Archiving
Scripts
Sequences
System Status
News Management
Migrations
Configuration
Plugins
Email Queue
Service Console
AI monitoring
Shared Files
Settings
CSP Headers
CSV Files
Scheduled Tasks
Processing Queues
Maintenance
Administration Menu
Licenses
Dynamic Tables
Usage Statistics
Access Token Settings & Session Expiration
Visual Identity
Template
Prints
Tasks
Task calculations
Automatic task completion and cancellation
Email Task and Notifications
Task types
Smart Event task
Instructions, Sections and Testing a Task
General task settings and solver
Multi-instance
Planning: start, branching and due date
Dynamic conditions: builder
Variable assignment and sections
Variables
Class diagram, object state import and alias candidates
Document list
Text and Multiline text
Checkbox
Number
Variables: overview and common settings
Lists (texts, numbers, dates)
Dynamic Rows
Date
Dynamic list
Sequence
Dynamic Table
Shredding Process
Template graph
Template Tab
Template List
Importing, Exporting and Copying a Template
Template Headers
Case statuses
Roles
Connecting to a different database
Diagnosing services
Hyper-V: Isolated NAT Network with Port Forwarding
Users
Translations
NFC Integration
Events and Rules
AXIOS API
Plans
Axios with Vault
Users
Axios with SSL Certificate
User Detail
Calculations & Functions
Form condition
Other dynamic conditions
Optimization of API calls on dynamic conditions
Filtering in a dynamic sheet using dynamic conditions
Dynamic Conditions: Script
Dynamic Rows: Script
Calculations
Dynamic Tables
Printing and File Generation
Documents in Calculations — Complete Guide
Printing and File Generation in Calculations
DOCX document creation
Other Calculations
How and when calculations run
Calculations API reference: the lib library
Calculations API reference: variables and case
Global Scripts and React Scripts
Integrations
MS Graph
MS Graph - cron configuration
MS Graph v2 (from v5.7.102)
MS Graph - preparing the mailbox
MS Graph (email)
ISDOC.PDF
DocuSign
TAS call module - TAS 2 TAS (process creation via API)
DB View
DocuSign and electronic signatures
ERP and other integrations
Smart Events for Integrations
TAS Forms
TAS Forms
Activating the module on the environment
TAS Forms - secret creation guide for Docker Swarm
Advanced Features & Tips
Filtering in a dynamic sheet using a URL parameter (static)
Optimizing Overviews with a Large Number of Cases
API Documentation
Product
Technical Changelog
Business Changelog
Version Upgrade Guide
Upgrade to v5.19
Upgrade to TAS 5.19 - Key Changes and Removed Features
Upgrading TAS 5.17 to 5.19 – Technical Part (DevOps)
Upgrate to v5.17
Upgrade to TAS 5.17 - Key Changes and Removed Features
Asset Migration from FE to Backend (5.17 Upgrade) — DevOps
Upgrading to v5.7
Lodash upgrade v4.17.x (>v5.5)
Main changes and deprecated features (v5.3 > v5.7)
Highlighting variables in Read-only status (>v5.7.58)
Upgrading to 5.3
Dynamic conditions migration
PDF printing adjustment
Editing Task Description vs Task Instructions
Transpiling forEach to a for loop
Rendering HTML on Caseoverview
Differences between TAS4 and TAS5 - a complete overview
Best Practices for Upgrading from v4 to v5
Using validation functions
Technical details
Server prerequisites
Security and Data Protection
Security
TAS Operations Runbook
Technological architecture
News / Important information
Microsoft Disabling Basic Auth for SMTP
End of EWS support and transition to Microsoft Graph
Adjustment in EWS after MS Exchange update (29.04.2025)
Security notices
Getting Started
Logs
Logs record what happens in the application: server errors and warnings, output from calculations, and how long important operations take. Administrators use them to find the causes of errors and slow response times. To open them, go to the Administration menu and click the Logs tile in the Application management and configuration group.
The page has three tabs: Logs, Calculation Logs and Performance Logs.
Logs
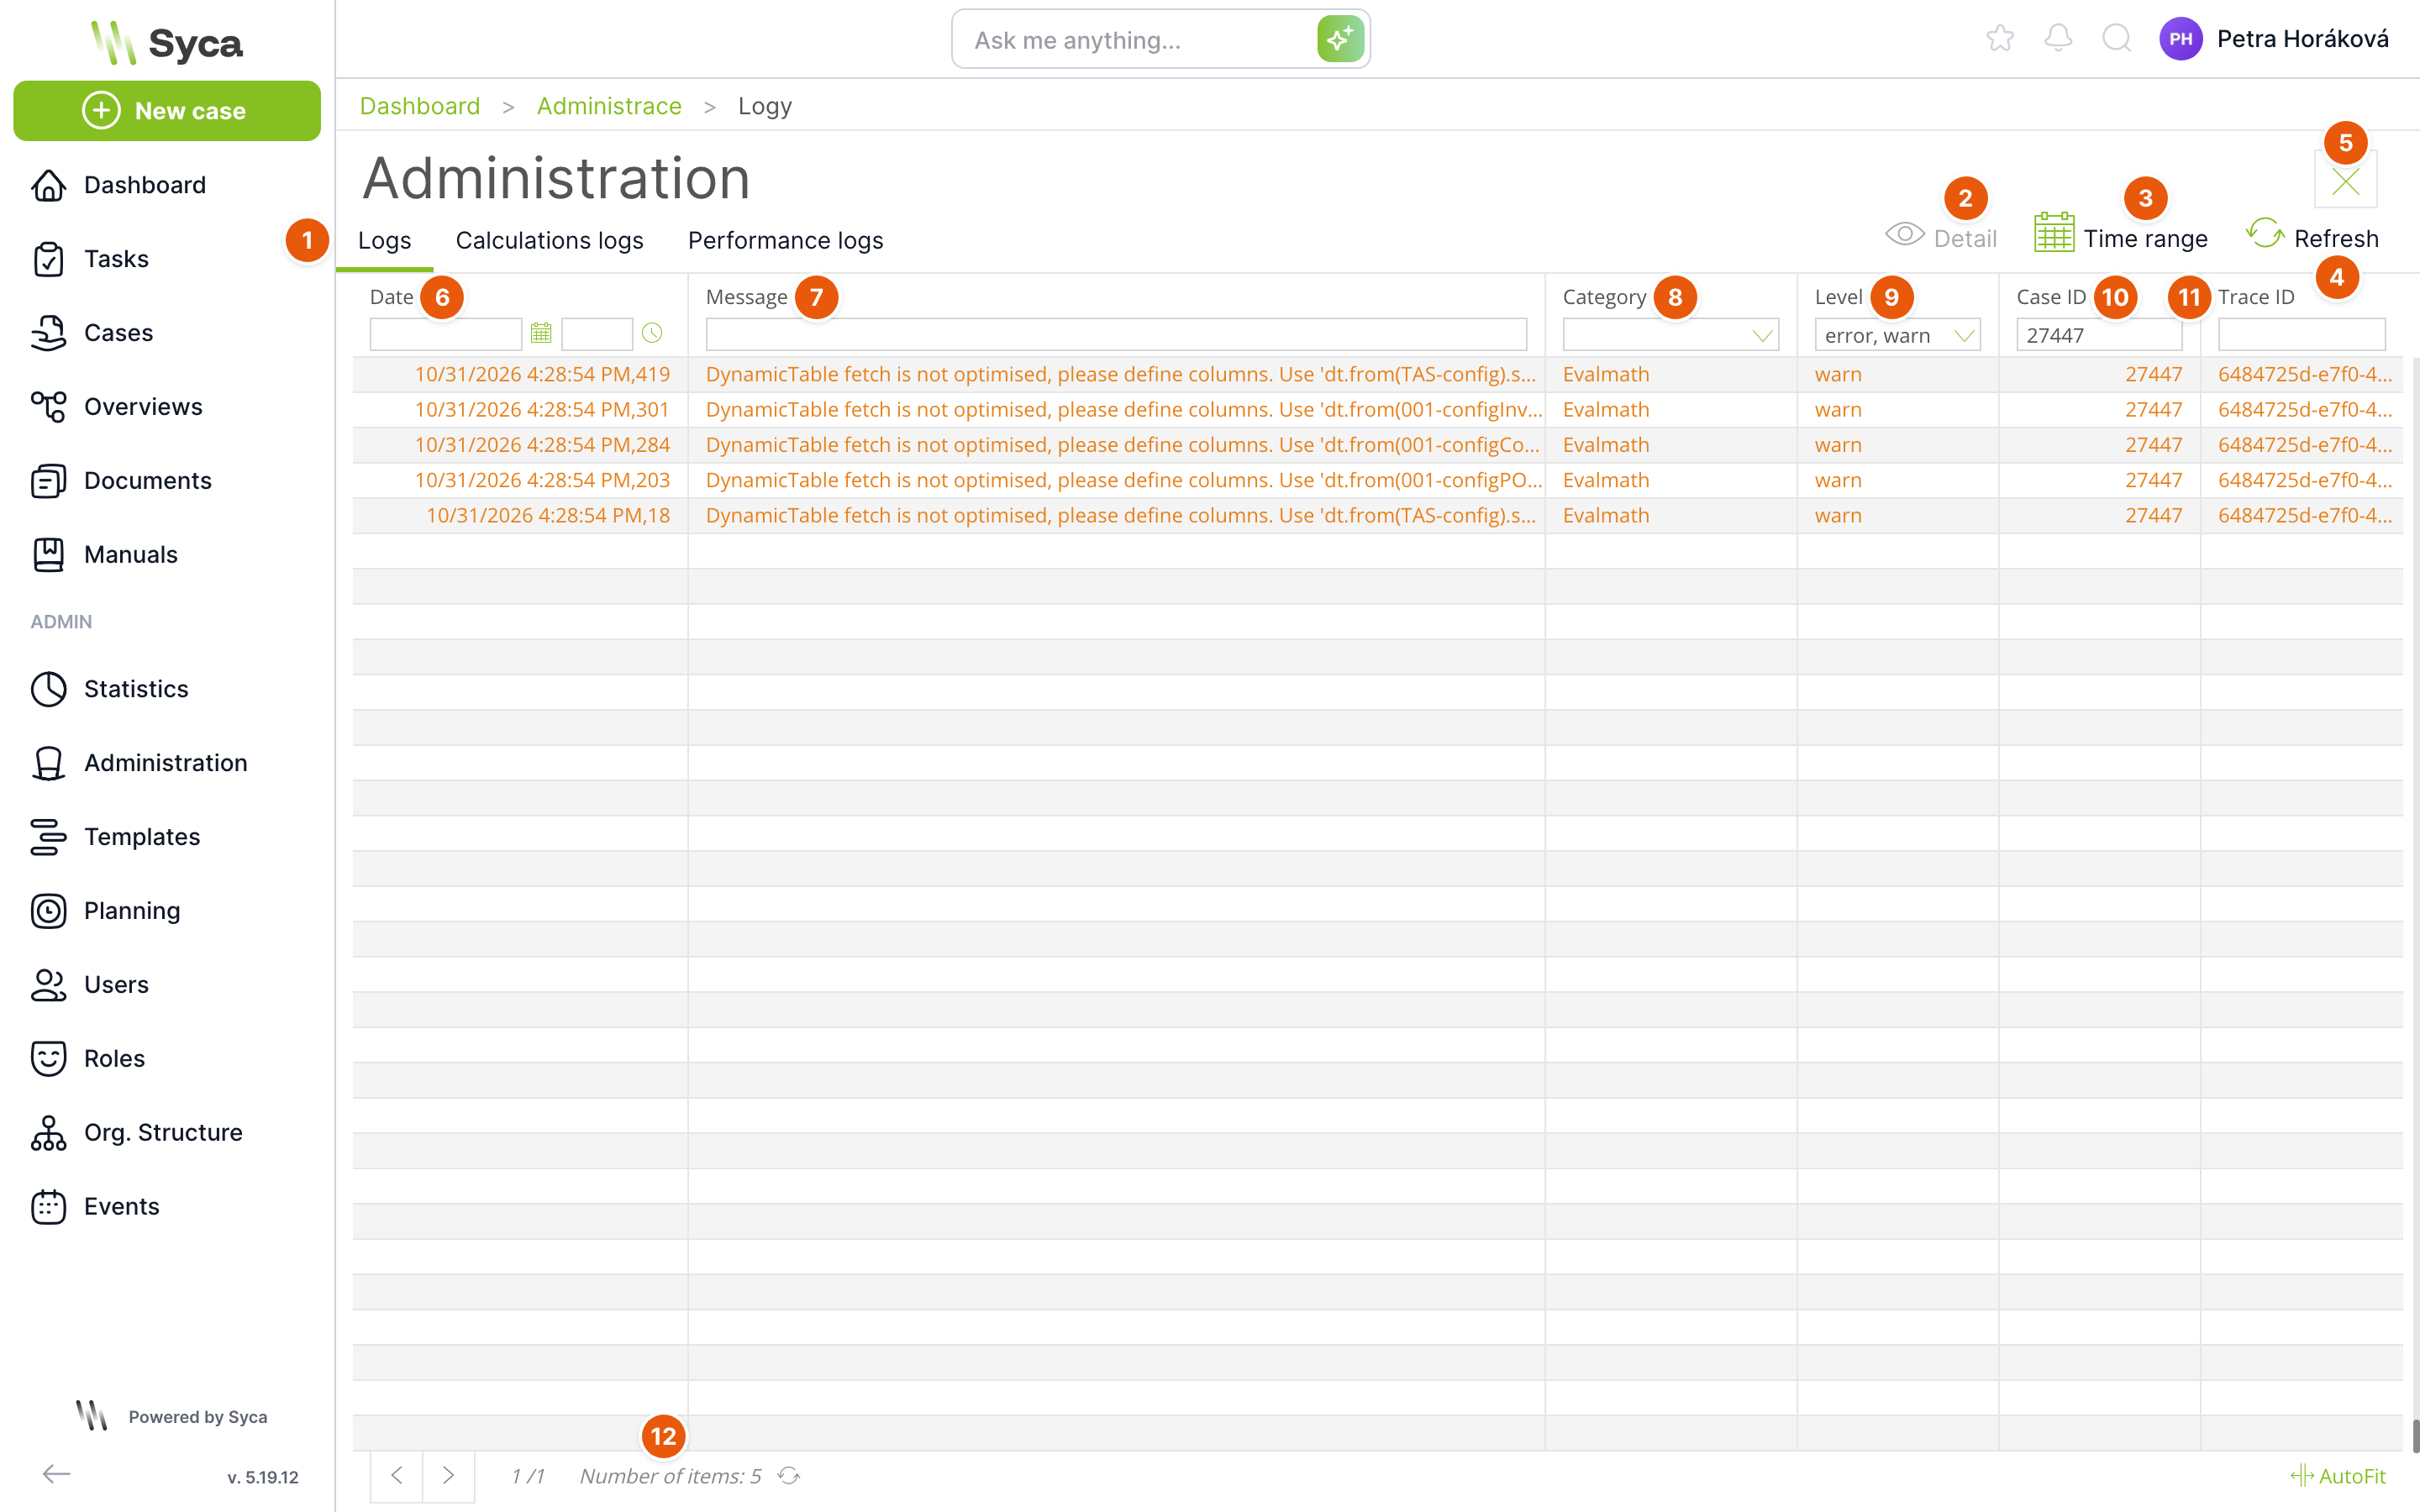
The screenshot shows the list filtered to one case using the Case ID column.
| No. | Element | Purpose |
|---|---|---|
| 1 | Tabs | Switch between Logs, Calculation Logs and Performance Logs. |
| 2 | Detail | Opens the detail of the selected record. Double-clicking a row does the same. |
| 3 | Time range | Limits the list to a from–to period. The button is highlighted when a range is set. |
| 4 | Refresh | Reloads the list. |
| 5 | Close | Takes you back to the Administration menu. |
| 6 | Date | Time of the record, including milliseconds. The filter selects a whole day, or a single hour if you also enter a time. |
| 7 | Message | Text of the record. The filter searches for the entered text anywhere in the message and ignores case. |
| 8 | Category | The area of the application the record comes from, for example Evalmath (calculations), Rest (requests from the browser), Workflow, Cron, Mail or Frontend. You can select more than one category in the filter. |
| 9 | Level | Severity: error, warn, info, debug, trace. By default, only error and warn are shown. |
| 10 | Case ID | The case the record relates to. The filter looks for an exact match. |
| 11 | Trace ID | Identifier of a single request. Click the value to filter all records of the same request. |
| 12 | Paging | Arrows for moving between pages, and the number of records. |
Press Enter to apply a column filter. Error rows are red and warning rows are orange. The list is sorted from the newest records, and you cannot change the sort order.
Time range
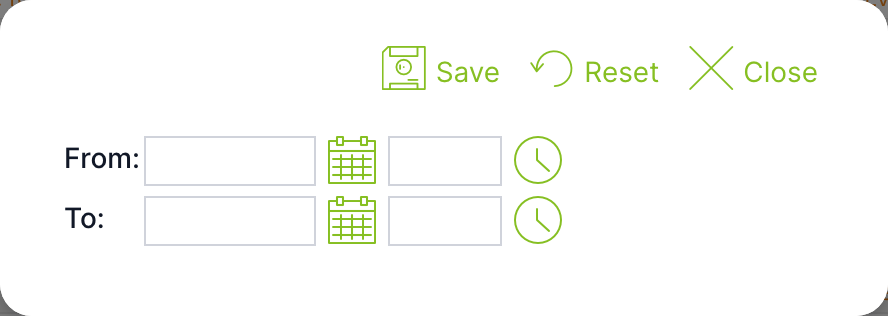
| Field | Purpose |
|---|---|
| From, To | Date and time of the start and end of the period. |
| Save | Applies the range and loads the list from the first page. |
| Reset | Clears the time range. |
| Close | Closes the window without making changes. |
The page remembers the range only while you are working with it. The range is not saved on the server.
Record detail

The detail shows the time and the full message. Below it is an expandable meta section with the technical data of the record, and for errors also the error stack trace. Click Download log to save the whole record as a JSON file, for example to send it to the vendor. Records that are too large are not shown in the window and can only be downloaded as a file.
Calculation Logs
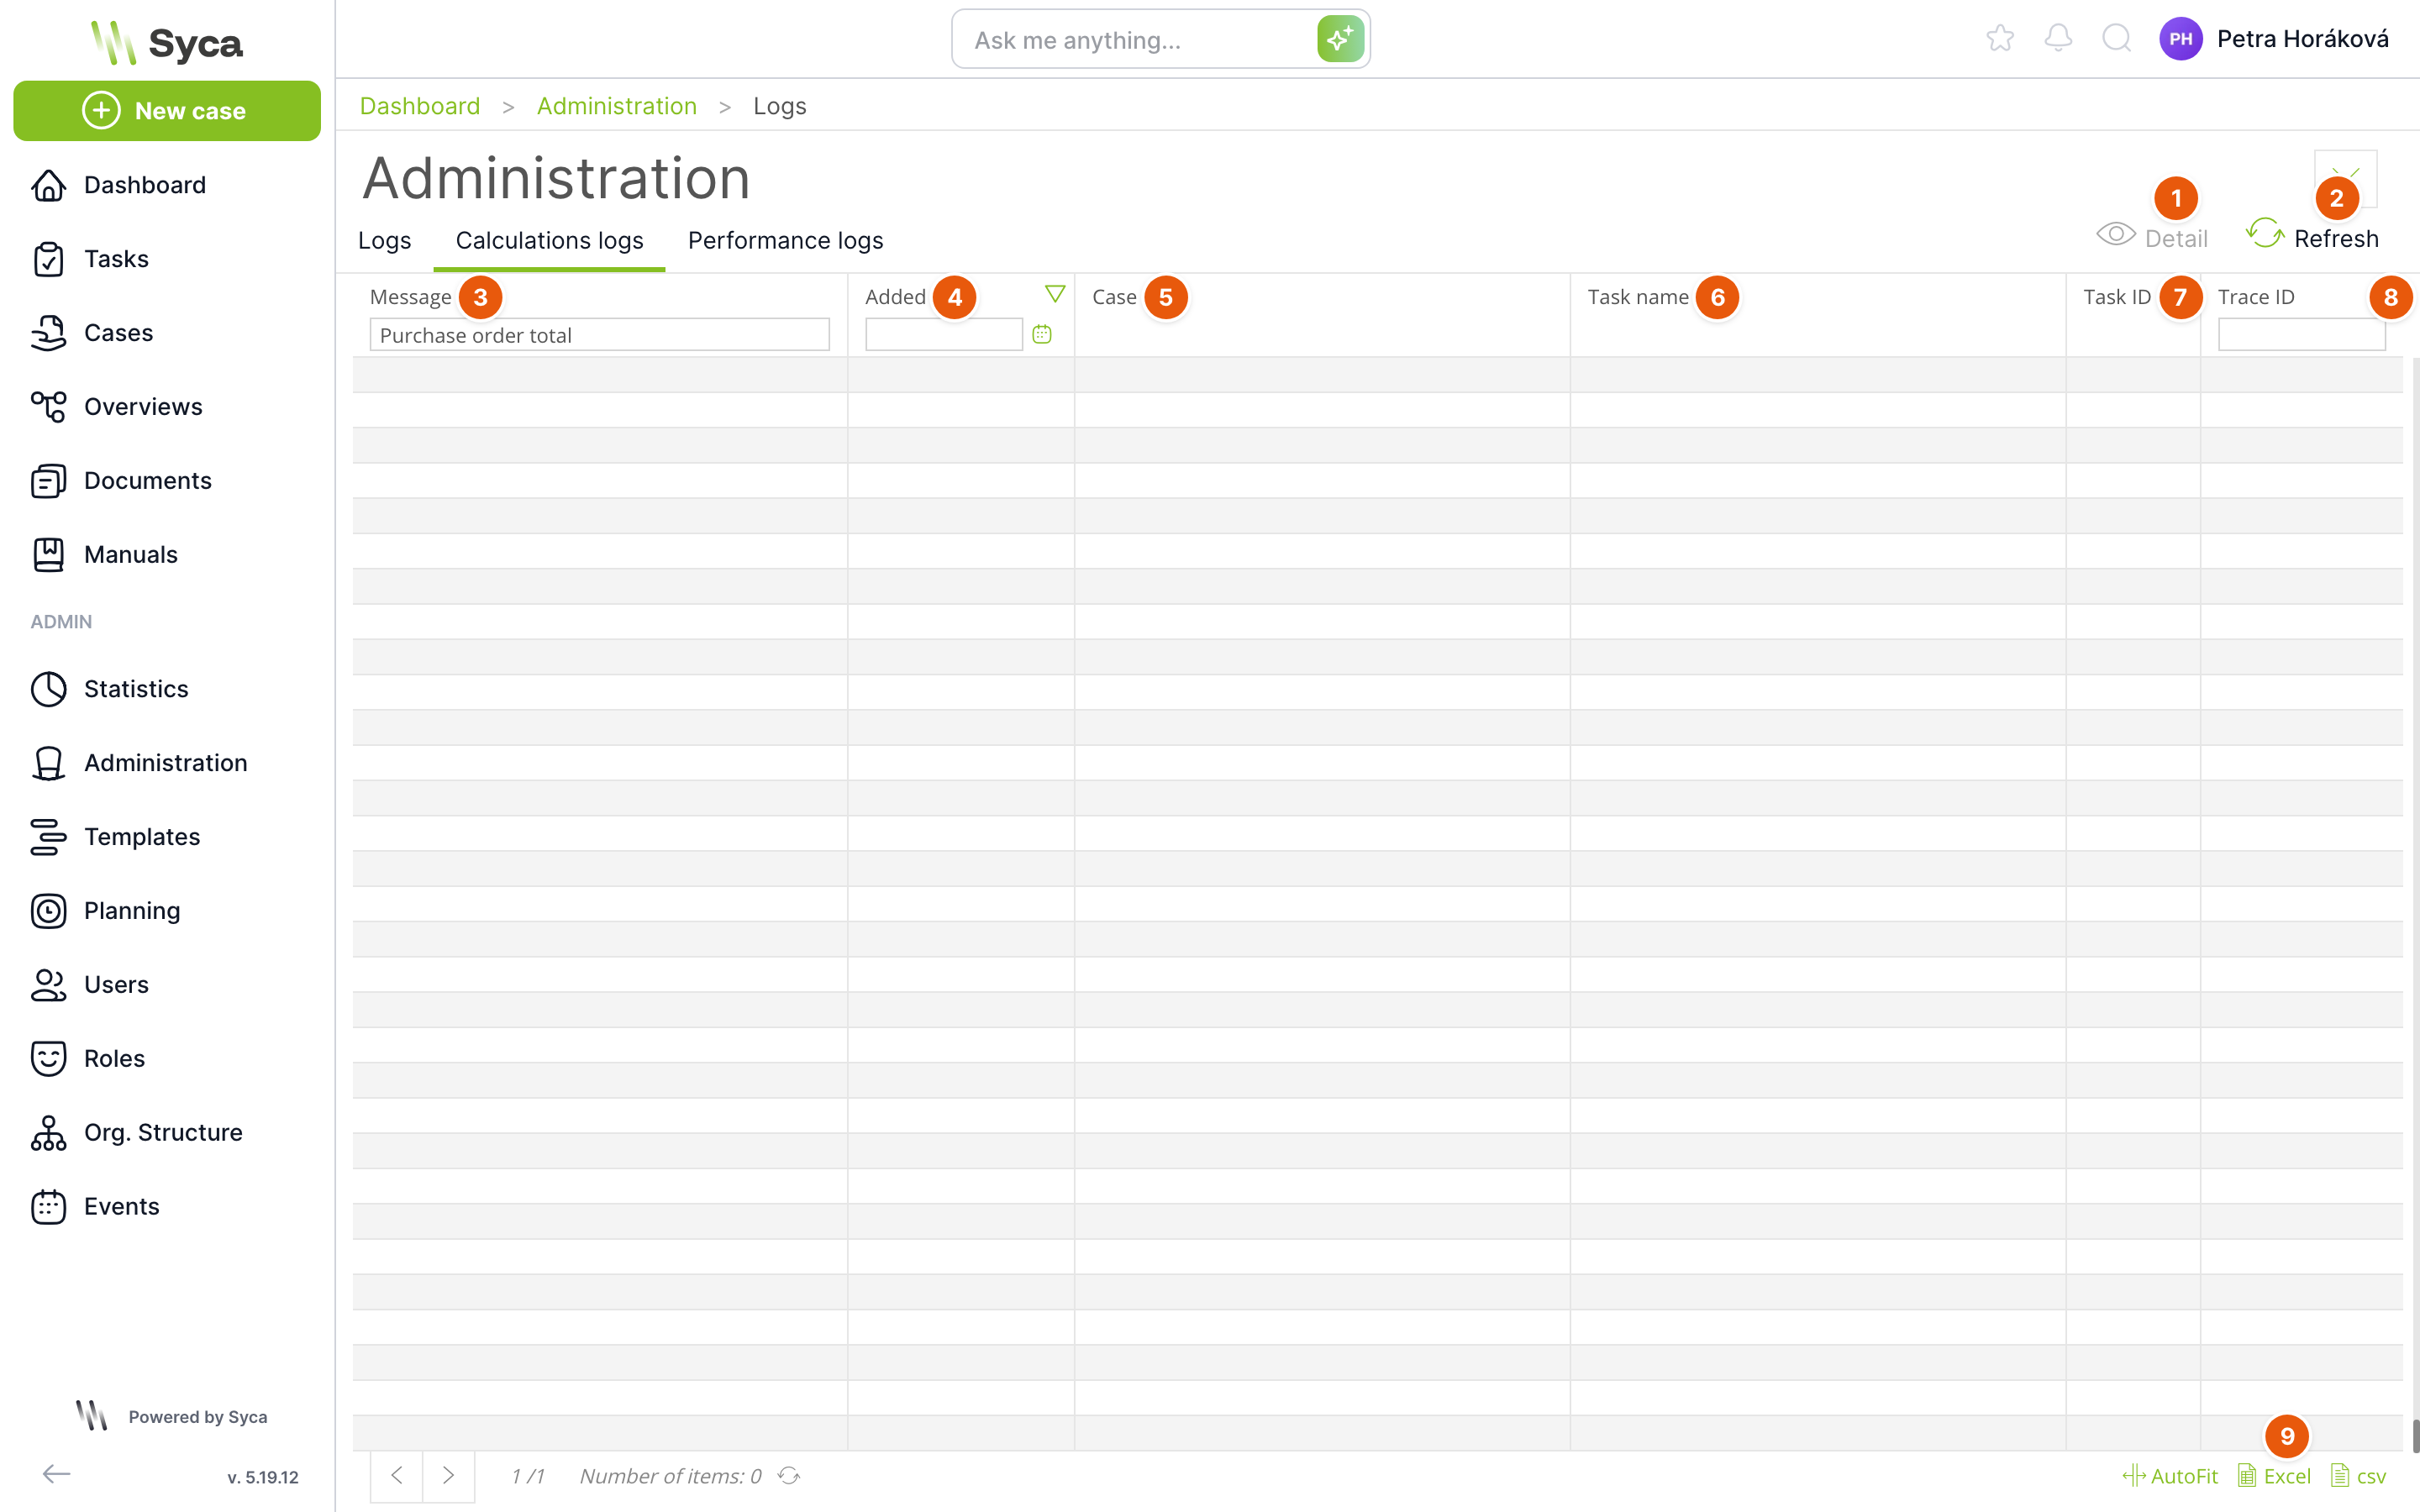
Records written by template calculations and scripts using debugging functions (debug.log). Template authors use them to check what a calculation did while it ran. The screenshot shows the list filtered on text that no record contains.
| No. | Element | Purpose |
|---|---|---|
| 1 | Detail | Opens the record detail, including the variable values written by the calculation. |
| 2 | Refresh | Reloads the list. |
| 3 | Message | Text written by the calculation. Can be filtered. |
| 4 | Inserted | When the record was created. Can be filtered by day. |
| 5 | Case | Name of the case in which the calculation ran. |
| 6 | Task name | The task whose calculation wrote the record. If the task still exists, click it to open its detail. |
| 7 | Task ID | Identifier of the task. |
| 8 | Trace ID | Identifier of the request. Click it to filter records of the same request. |
| 9 | Export | Exports the list to Excel or CSV. |
Performance Logs
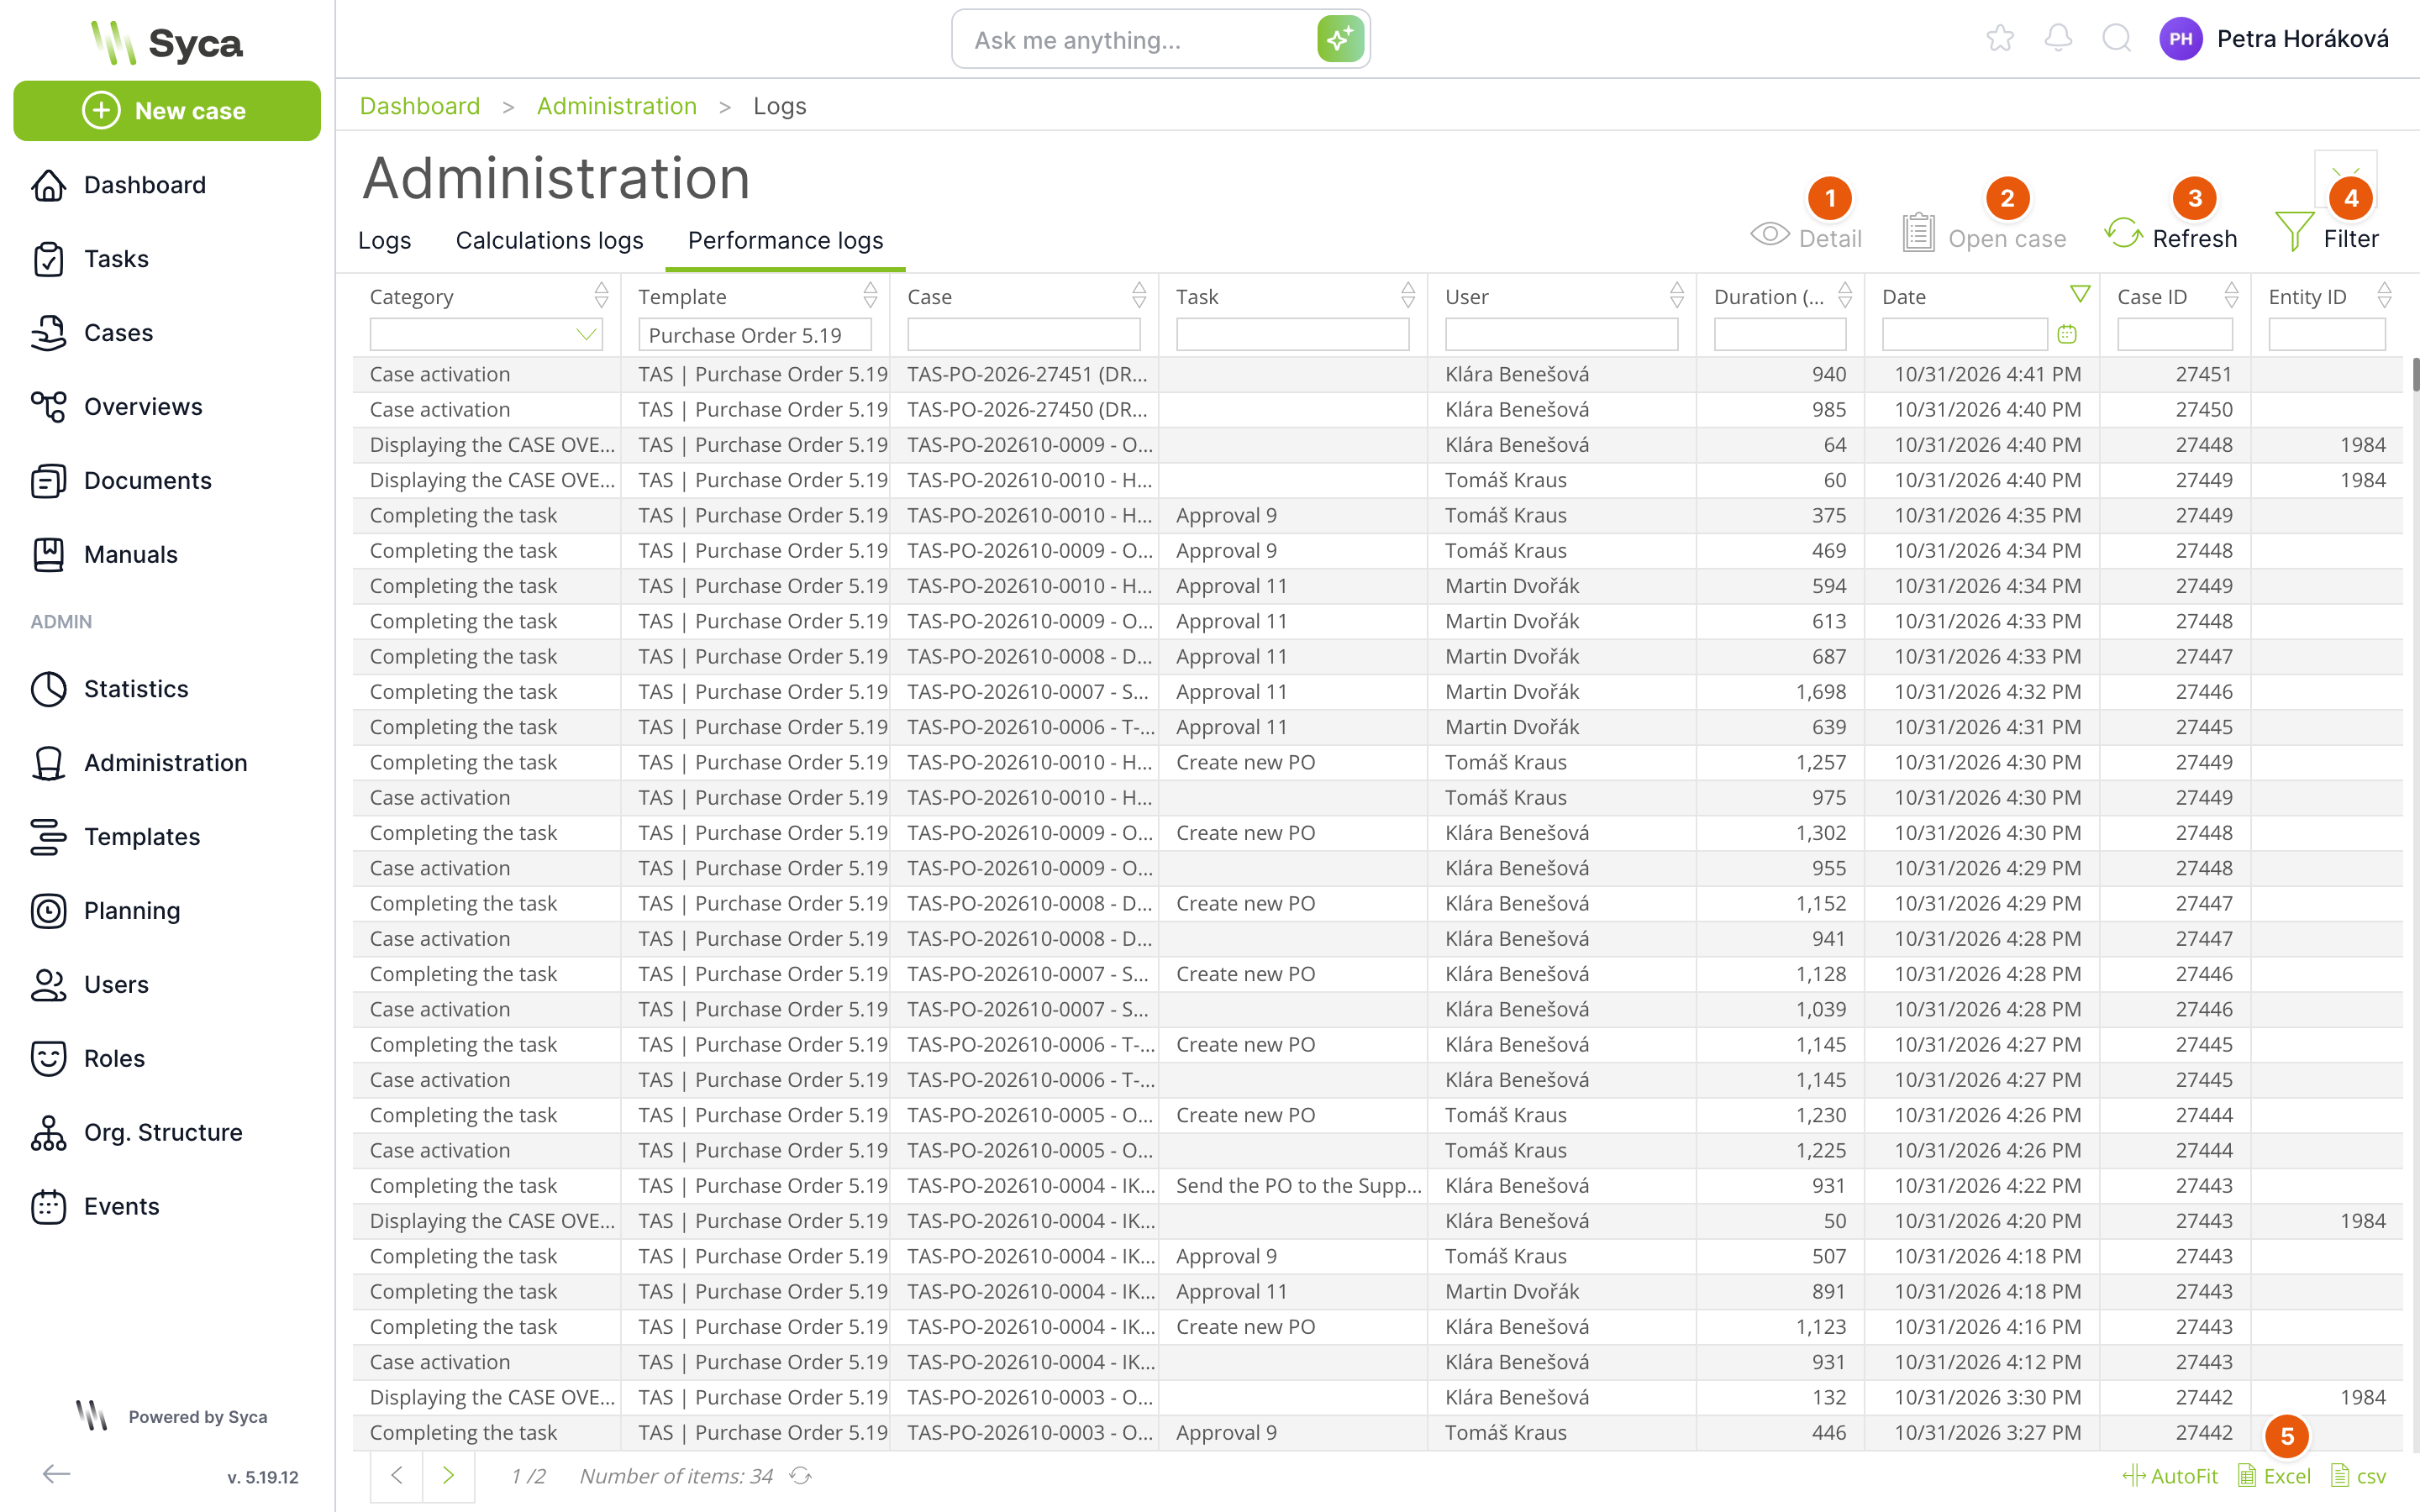
How long important operations take. They help you find the template, task or overview that is slowing down the application. The screenshot shows the list filtered to an order template.
| No. | Element | Purpose |
|---|---|---|
| 1 | Detail | Opens a chart of the duration of comparable operations. |
| 2 | Open case | Opens the case of the selected row. Active only for rows that have a case. |
| 3 | Refresh | Reloads the list. |
| 4 | Filter | Saved filters of the list. |
| 5 | Export | Exports the list to Excel or CSV. |
List columns:
| Column | Content |
|---|---|
| Category | Type of operation, see the table below. |
| Template, Case, Task | Where the operation took place. |
| User | Who started the operation. |
| Duration (ms) | Length of the operation in milliseconds. The filter shows operations longer than the entered value. |
| Date | When the operation took place. By default, the list is sorted from the newest. |
| Case ID, Entity ID | Identifiers of the case and of another object, for example an overview. |
| Category | When it is recorded |
|---|---|
| Case creation | A user creates a case. |
| Overview display | A user opens an overview. |
| Task completion | A user completes a task. |
| CASE OVERVIEW display | A user opens the Case Overview. |
| Print creation | A print is created. |
| XML process import | A process is imported from XML. |
| Statistics | A statistic is displayed. |
| Process archiving, Process unarchiving | A case is archived or restored from the archive. |
| Task copying (Multiinstance) | A copy of a multi-instance task is created. |
| Calculation, Email notification, Link conditions, Case completion check, Solver search | Individual steps of task processing. |
The scope of performance logs is set by the
featureFlag.perfLogs.category item in Configuration. The value 0 turns recording off, 1 (default) records user actions, 2 adds task copying, and 3 also adds the individual steps of task processing.Duration chart
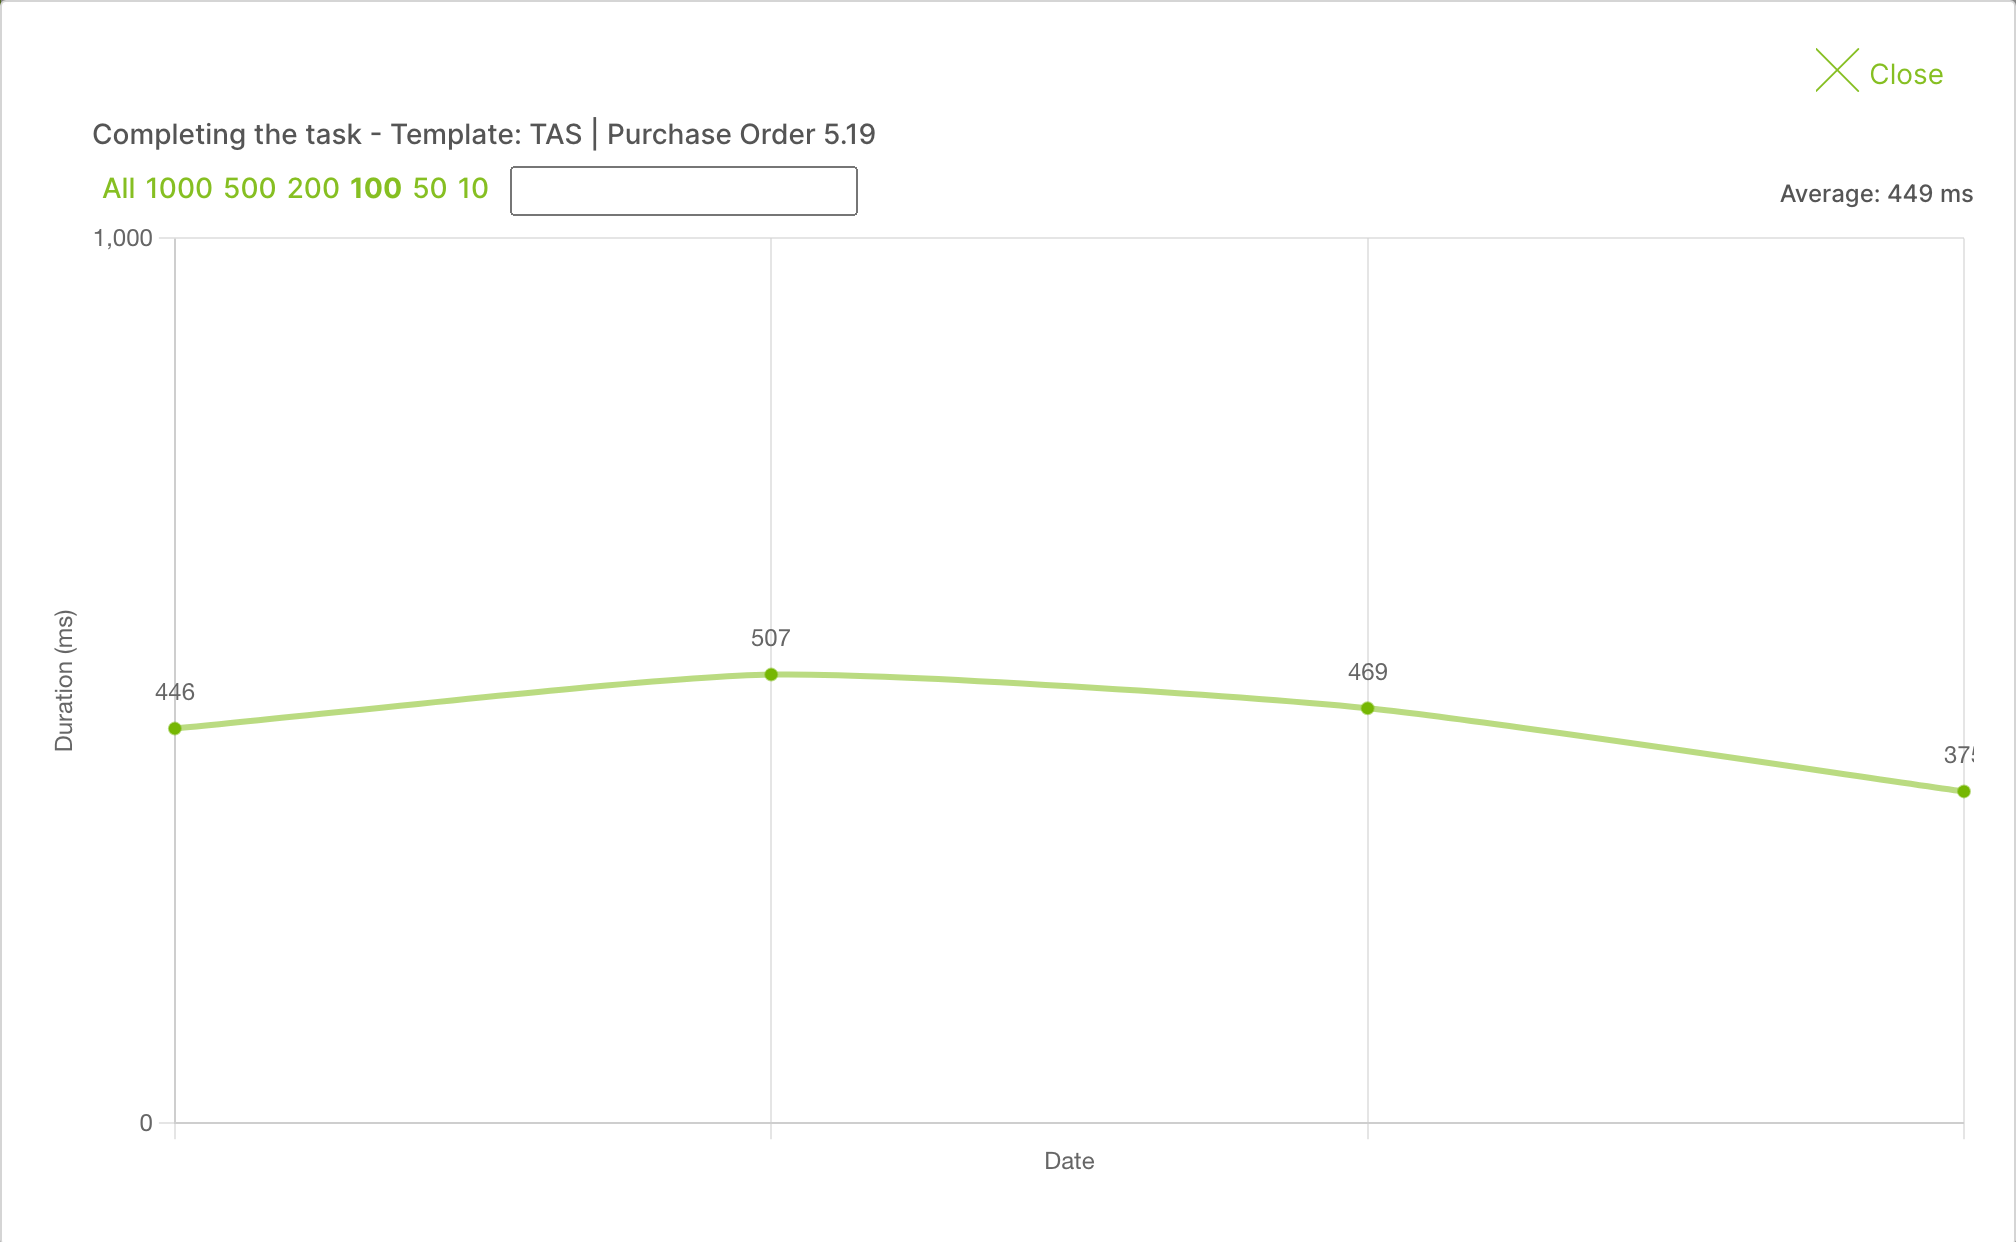
The chart shows the duration of the same type of operation on the same template, task or overview over time. Above the chart, choose how many of the latest records to show (All, 1000, 500, 200, 100, 50, 10), or enter your own number in the field and press Enter. The average duration in milliseconds is shown on the right.
How long logs are kept
Old records are deleted every night by a scheduled job with the technical name DeleteLogs. By default, it deletes errors and warnings after 20 days, other records and calculation logs after 10 days, and meta technical data after 30 days. You can change these periods in the parameters of this job in the Crons section. Performance logs are deleted by the Cleanup old data from Database job. You cannot delete records manually on the Logs page.
When a user reports an error, find out the case ID or the approximate time. Filter the Logs by case ID or time range, find the red row and click its Trace ID. You will see all records of the same request, including those that came before the error.
Related: Crons, Configuration, Scripts.