User guide
Quick Start Guide
Case notes
Table component
FAQ
Search
Dashboard
Deleted Documents and Access Log
Solving a task
AI Assistant
Manuals
Substitution and Vacation
Suspending, resuming, archiving and deleting a case
Case variables, history and graph
Basic Terms
Uploading Documents, Folders and Revisions
News
Favorites
Navigating the interface
Dashboard widgets
Case Detail
News/Announcements in Team assistant
Case list
Logging In and Out
Account Settings
Task List
Mobile app settings
Reports and Charts
Searching and Listing Documents
Handing Over, Taking Over and Tasks to Pull
Bulk Tasks
Printing a Case
Creating and Editing an Overview
What Is TAS
Form Fields
Tablet Interface and NFC
Overviews
Creating a New Case
Case Events
Case Permissions
Subscribing to an overview by email
Administrator Guide
Platform guide
Administration
Crons
Authentication and Synchronization
SMTP OAuth authentication
LDAP, SAML, Entra ID and NFC: Settings
Configuring authentication modules
Authentication
Vault
DMS attributes
Service Operations
Mobile App Setup for Your Environment
Scheme
XML Process Import
HR agenda and agenda handover
Logs
Archiving
Scripts
Sequences
System Status
News Management
Migrations
Configuration
Plugins
Email Queue
Service Console
AI monitoring
Shared Files
Settings
CSP Headers
CSV Files
Scheduled Tasks
Processing Queues
Maintenance
Administration Menu
Licenses
Dynamic Tables
Usage Statistics
Access Token Settings & Session Expiration
Visual Identity
Template
Prints
Tasks
Task calculations
Automatic task completion and cancellation
Email Task and Notifications
Task types
Smart Event task
Instructions, Sections and Testing a Task
General task settings and solver
Multi-instance
Planning: start, branching and due date
Dynamic conditions: builder
Variable assignment and sections
Variables
Class diagram, object state import and alias candidates
Document list
Text and Multiline text
Checkbox
Number
Variables: overview and common settings
Lists (texts, numbers, dates)
Dynamic Rows
Date
Dynamic list
Sequence
Dynamic Table
Shredding Process
Template graph
Template Tab
Template List
Importing, Exporting and Copying a Template
Template Headers
Case statuses
Roles
Connecting to a different database
Diagnosing services
Hyper-V: Isolated NAT Network with Port Forwarding
Users
Translations
NFC Integration
Events and Rules
AXIOS API
Plans
Axios with Vault
Users
Axios with SSL Certificate
User Detail
Calculations & Functions
Form condition
Other dynamic conditions
Optimization of API calls on dynamic conditions
Filtering in a dynamic sheet using dynamic conditions
Dynamic Conditions: Script
Dynamic Rows: Script
Calculations
Dynamic Tables
Printing and File Generation
Documents in Calculations — Complete Guide
Printing and File Generation in Calculations
DOCX document creation
Other Calculations
How and when calculations run
Calculations API reference: the lib library
Calculations API reference: variables and case
Global Scripts and React Scripts
Integrations
MS Graph
MS Graph - cron configuration
MS Graph v2 (from v5.7.102)
MS Graph - preparing the mailbox
MS Graph (email)
ISDOC.PDF
DocuSign
TAS call module - TAS 2 TAS (process creation via API)
DB View
DocuSign and electronic signatures
ERP and other integrations
Smart Events for Integrations
TAS Forms
TAS Forms
Activating the module on the environment
TAS Forms - secret creation guide for Docker Swarm
Advanced Features & Tips
Filtering in a dynamic sheet using a URL parameter (static)
Optimizing Overviews with a Large Number of Cases
API Documentation
Product
Technical Changelog
Business Changelog
Version Upgrade Guide
Upgrade to v5.19
Upgrade to TAS 5.19 - Key Changes and Removed Features
Upgrading TAS 5.17 to 5.19 – Technical Part (DevOps)
Upgrate to v5.17
Upgrade to TAS 5.17 - Key Changes and Removed Features
Asset Migration from FE to Backend (5.17 Upgrade) — DevOps
Upgrading to v5.7
Lodash upgrade v4.17.x (>v5.5)
Main changes and deprecated features (v5.3 > v5.7)
Highlighting variables in Read-only status (>v5.7.58)
Upgrading to 5.3
Dynamic conditions migration
PDF printing adjustment
Editing Task Description vs Task Instructions
Transpiling forEach to a for loop
Rendering HTML on Caseoverview
Differences between TAS4 and TAS5 - a complete overview
Best Practices for Upgrading from v4 to v5
Using validation functions
Technical details
Server prerequisites
Security and Data Protection
Security
TAS Operations Runbook
Technological architecture
News / Important information
Microsoft Disabling Basic Auth for SMTP
End of EWS support and transition to Microsoft Graph
Adjustment in EWS after MS Exchange update (29.04.2025)
Security notices
Getting Started
- All Categories /
- Administrator Guide
- Platform guide
- Administration /
- Usage Statistics
Usage Statistics
Usage statistics show how TAS is used, month by month: the number of active users, templates and headers, how many cases were created and how many tasks were completed. They are useful for an overview of the scope of the deployment and for licensing purposes. The page is available to administrators. To open it, go to the Administration menu and click the Usage statistics tile in the Monitoring and maintenance category.
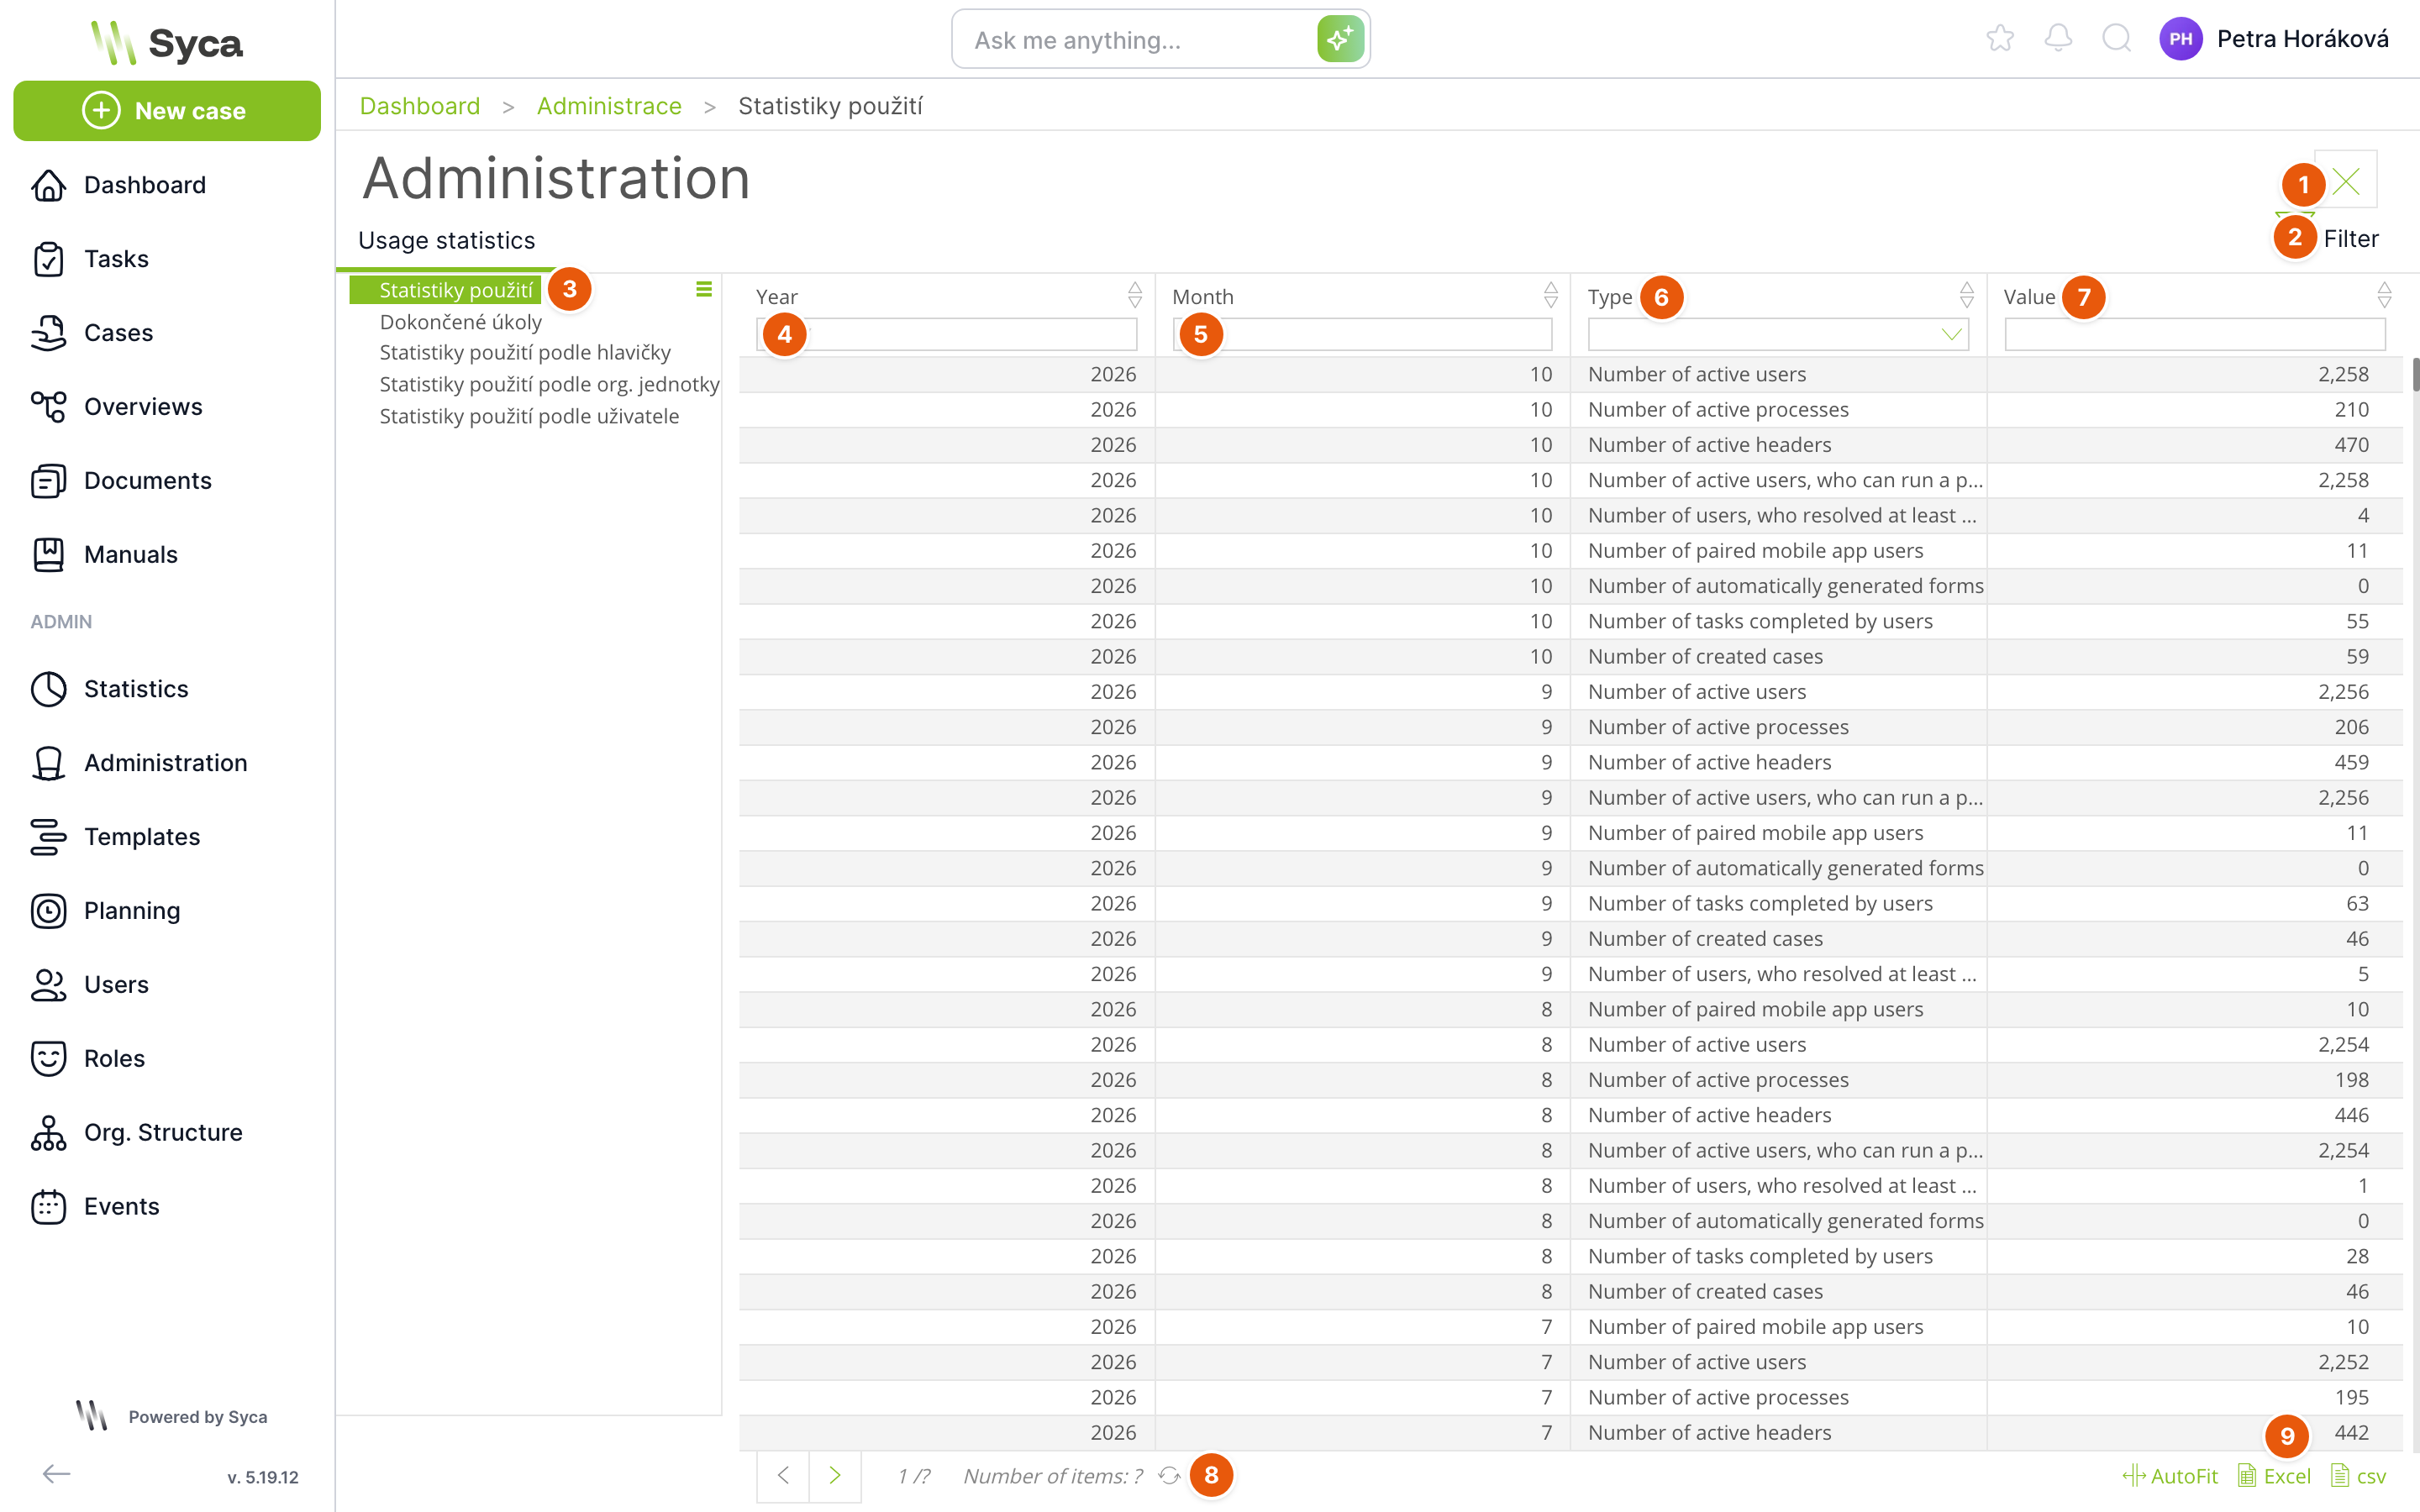
| No. | Element | Purpose |
|---|---|---|
| 1 | Close | Returns you to the Administration menu. |
| 2 | Filter | Opens a detailed filter for the displayed table. |
| 3 | View tree | Selects the view: Usage statistics, Completed tasks, Usage statistics by header, Usage statistics by org. unit and Usage statistics by user. The selected view is highlighted. |
| 4 | Year | Filter by year. Enter the full year, for example 2026. |
| 5 | Month | Filter by month number, for example 10 for October. |
| 6 | Type | Selects one indicator from the list. |
| 7 | Value | Value of the indicator for the given month. |
| 8 | Paging | Arrows for moving between table pages, and the number of records. |
| 9 | Export | The AutoFit button (adjusts column widths), and the Excel and csv buttons for downloading the table. |
By default, the tables are sorted from the most recent month. You can change the sorting by clicking the arrows in the column header.
Where the numbers come from
The statistics are gathered by the Gather usage statistics cron every night at 1:30. It stores the values for the current month and overwrites them with fresh values every day. In addition, on the first day of each month it calculates the final values for the previous month for indicators that count work (completed tasks, created cases and similar). State indicators (the number of active users, templates, headers and paired mobile devices) therefore show the state as of the last day of a closed month.
Users listed in the featureFlag.statisticsIgnoredUsers configuration key are not included in the statistics. By default, this is the user with ID 1, i.e. the system account. The exception is Number of created cases, which counts all cases regardless of their owner.
Values for the current month are recalculated every night. Final figures for a month are only available after the first day of the following month.
Usage statistics
A summary table of all indicators by month. Columns Year, Month, Type and Value.
| Type | What it counts |
|---|---|
| Number of active users | Users with the active status. |
| Number of active processes | Active process templates. |
| Number of active headers | Enabled template headers. |
| Number of active users who can start a process | Active users who have the right to create a case from at least one active template. A user with the administrator system role (−1) or −2 is always counted if at least one active template exists. |
| Number of users who solved at least one task | Users who completed at least one regular task in the given month. |
| Number of solvers who solved a task or can start a process | The union of the two previous groups: users who completed a task in the month or can create a case. It is not gathered separately; TAS composes it when the table is displayed. |
| Number of paired mobile app users | Users who have at least one paired mobile device. |
| Number of automatically generated forms | Forms generated by the TAS Forms service, based on its billing data. If TAS Forms is not set up, the value is 0. |
| Number of tasks completed by users | Regular tasks completed by users in the given month. |
| Number of created cases | Cases created in the given month. |
Task indicators only include regular tasks, not events or technical template steps.
Completed tasks
A list of individual completed tasks with the year and month of completion. Columns Year, Month, Template, Header, Task and Solver (display name of the user who completed the task). Click the Task button or double-click a row to open the task detail. The list contains the names of real solvers, so it is not shown here.
Usage statistics by header
The number of cases created in each month, broken down by template header. Columns Year, Month, Header and Number of started cases. Cases owned by an ignored user are not included in the count.

| No. | Element | Purpose |
|---|---|---|
| 1 | Selected view | Usage statistics by header. |
| 2 | Header | Header name. You can type part of the name into the field below the column header to filter the table. |
| 3 | Number of started cases | How many cases with this header were created in the given month. |
Usage statistics by org. unit
The number of tasks completed in each month, broken down by the solver's organizational unit. Columns Year, Month, Org. unit name and Number of completed tasks. If the solver belongs to multiple units, the task is counted for each of them.
Usage statistics by user
The number of tasks each user completed in each month. Columns Year, Month, E-mail, User name (display name), Org. unit name and Number of completed tasks. The view contains users' personal data, so it is not shown here.
How to find the number of active users for a specific month
- In the tree, select Usage statistics.
- Type the year in the Year column and the month number in the Month column.
- In the Type column, select Number of active users.
- To export, click Excel or csv at the bottom.
Related: Crons, Configuration, Administration menu