System Status
System Status shows in real time whether TAS and all the services it depends on are working. Here you will find the overall status, individual components with metrics and charts, live database activity and the status of crons. The page is available to administrators. Open it from the Administration menu using the System Status card in the Monitoring and Maintenance category.
The page has three tabs: Overview, Database Activity and Cron Monitor. The data refreshes automatically every 10 seconds.
Overview
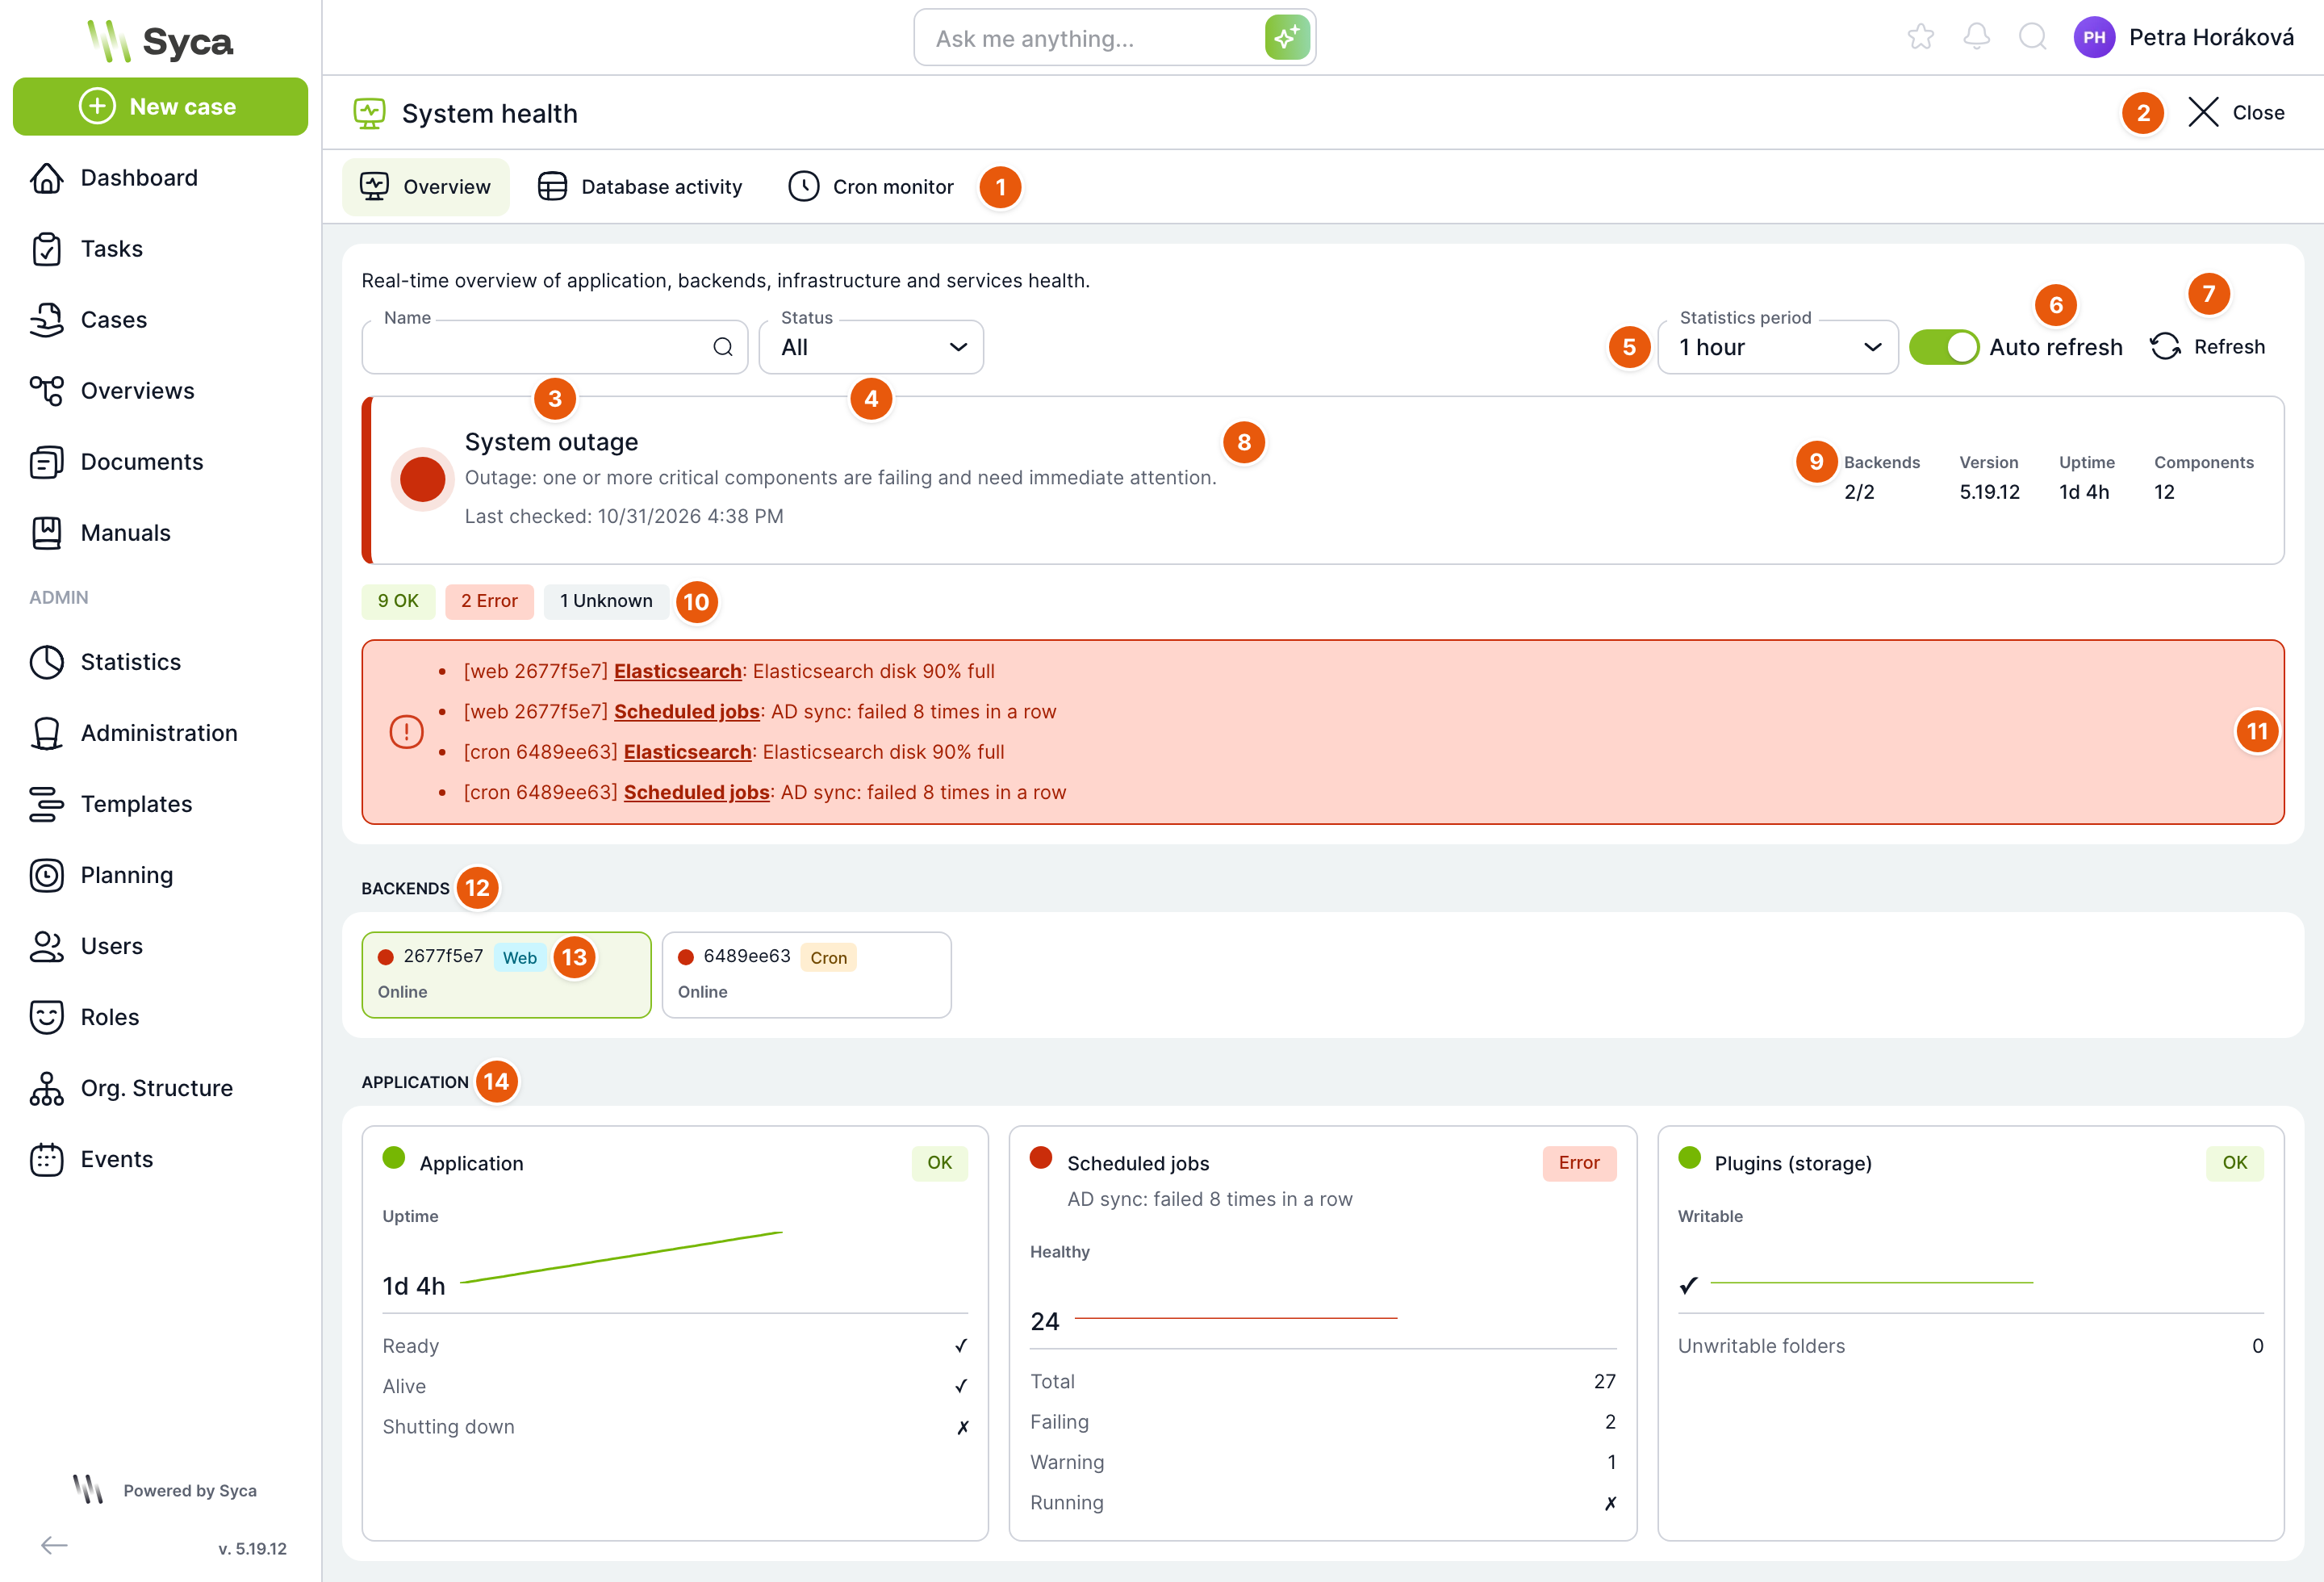
| No. | Element | Purpose |
|---|---|---|
| 1 | Tabs | Overview, Database Activity and Cron Monitor. |
| 2 | Close | Returns you to the Administration menu. |
| 3 | Name | Filters the component cards by name. Click the cross to clear the filter. |
| 4 | Status | Shows only components in the selected status: All, Error, Warning, OK or Unknown. |
| 5 | Statistics period | The period the charts cover: 15 minutes, 1 hour (default), 8 hours, 1 day or 2 days. |
| 6 | Auto refresh | When on (default), refreshes the data every 10 seconds. Turn it off when you want to examine the status at your own pace. |
| 7 | Refresh | Loads the data immediately. |
| 8 | Overall status | A coloured bar with a heading and description of the status of the whole installation and the time of the last check. |
| 9 | Summary data | Backends (how many are online out of the total), Version, Uptime and the number of Components of the selected backend. |
| 10 | Counts by status | How many components of the selected backend are OK, in Warning, Error and Unknown status. Click a label to show only those components; click again to clear the filter. |
| 11 | Problem list | All components in Warning or Error status on all online backends. Each row starts with the backend type and shortened ID. Click the underlined component name to switch to that backend and filter for this component. When everything is fine, the list is not shown. |
| 12 | Backends | All running application instances. |
| 13 | Backend card | Shortened instance ID, type Web (serves users) or Cron (runs scheduled jobs), a coloured dot with the status and the Online indicator, or Offline with the time of the last report. Click to select the backend whose components are shown below. The selected backend is highlighted. |
| 14 | Component groups | Components are divided into the groups Application, Infrastructure and Services. |
Overall status
| Heading | Colour | Meaning |
|---|---|---|
| All systems operational | green | All checks passed, the application is fully operational. |
| Degraded system performance | orange | The application is running, but at least one component reports a warning. Resolve it to keep operation smooth. |
| System outage | red | At least one component is failing and requires immediate attention. |
| Unknown | grey | Some checks could not be evaluated, or no backend is reporting status. |
The overall status is always the worst status of all components on all online backends, in the order OK, Unknown, Warning, Error. A single component in Unknown status therefore switches the summary from “All systems operational” to “Unknown”, even if everything else is fine. However, components in Unknown status are not added to the problem list.
Each backend checks itself once a minute and keeps history for 48 hours. A backend that has not reported for 3 minutes is shown as Offline and disappears from the list after 10 minutes. The interval, history length and Offline threshold are set by whoever installed TAS, using the environment variables
TAS_HEALTH_SAMPLE_INTERVAL_SEC, TAS_HEALTH_RETENTION_HOURS and TAS_HEALTH_STALE_AFTER_SEC.Component card
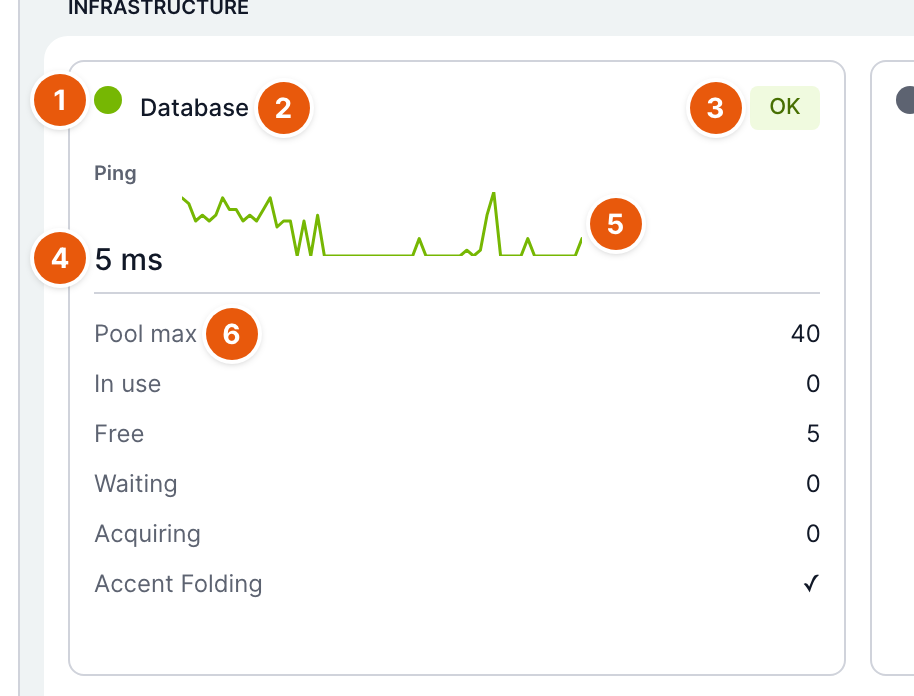
| No. | Element | Purpose |
|---|---|---|
| 1 | Coloured dot | Component status: green OK, orange Warning, red Error, grey Unknown. |
| 2 | Name | Component name. Component and metric names are displayed in English. |
| 3 | Status label | Component status in words. Below the name there may also be a message with the cause of the problem. |
| 4 | Main metric | The component's most important value, shown in large type. |
| 5 | Sparkline | Trend of the main metric over the selected period. Shown once at least two samples are available. |
| 6 | Other metrics | The component's other values. ✓ means yes, ✗ means no. |
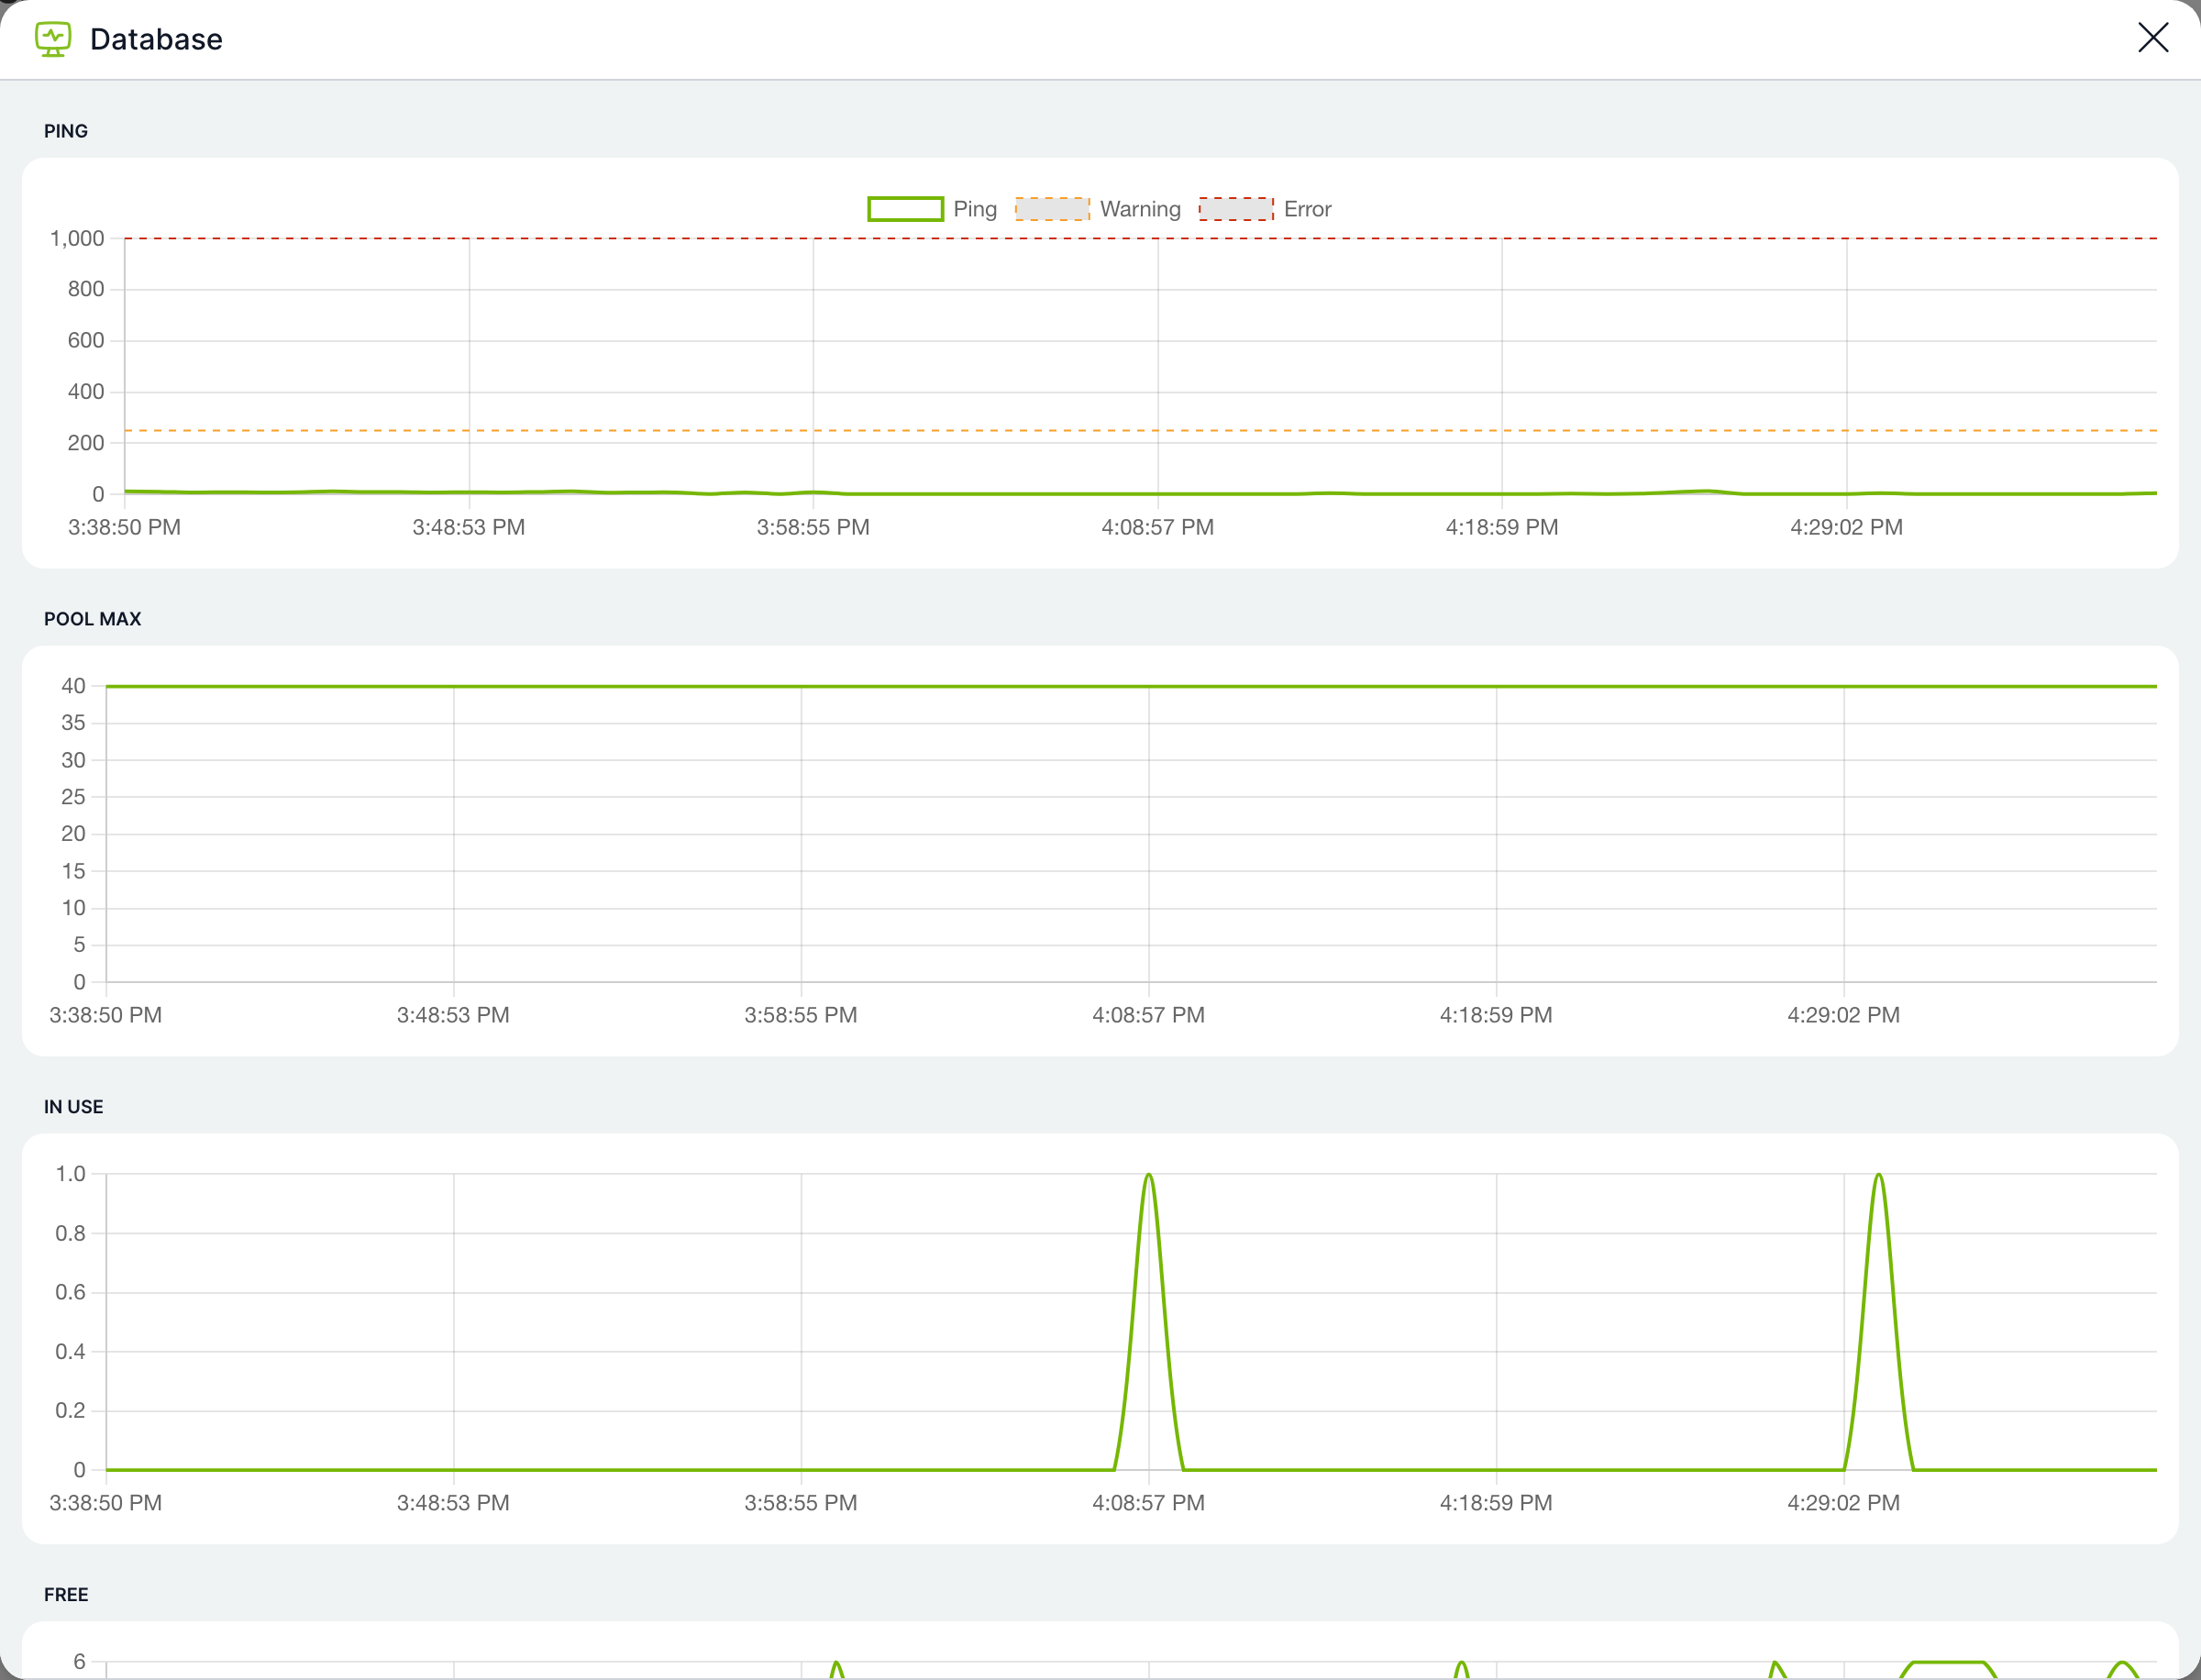
Click a card to open a detail view with charts of all numeric metrics for the selected period. If a metric has thresholds, the chart shows the Warning threshold (orange) and the Error threshold (red) as dashed lines. Until at least two samples have been collected, you will see the message Collecting data… charts will appear after a few samples instead of the charts.
Components and their thresholds
Each check has a 5-second limit. If it is exceeded, the component is in Unknown status with the message “Probe timed out”.
| Component | Group | Metrics | OK | Warning | Error |
|---|---|---|---|---|---|
| Application | Application | Uptime (main), Ready, Alive, Shutting down | The instance is ready (web) or alive (cron). | The instance is not ready (“Instance not ready”). | The instance is shutting down. |
| Scheduled jobs | Application | Healthy (main), Total, Failing, Warning, Running | All crons are green. | At least one cron is yellow. | At least one cron is red. The message states the first problem. |
| Plugins (storage) | Application | Writable (main), Unwritable folders | All plugin folders are writable. | Some plugin folder is not writable; updating these plugins from the store would fail. | – |
| Database | Infrastructure | Ping (main), Pool max, In use, Free, Waiting, Acquiring, Accent Folding | Response under 250 ms and no one is waiting for a free connection. | Response of 250 ms or more, at least one request is waiting for a connection (Waiting greater than 0), or the unaccent extension is missing on PostgreSQL even though featureFlag.disableAccentSensitivity is enabled. | Response of 1 s or more, or the database is unavailable. |
| Database Activity | Infrastructure | Active queries (main), Open transactions, Idle in transaction, Blocked sessions, Longest query, Oldest transaction | Longest query under 30 s, no idle transaction and no blocked session. | Longest query of 30 s or more, or there is a session idle in transaction. | Longest query of 2 minutes or more, or there is a blocked session. |
| Elasticsearch | Infrastructure | Unindexed files (main), Running, Cluster, Index size, Disk used, Disk total, Index data on disk | Cluster green, fewer than 1,000 unindexed files, disk under 85%. | Cluster yellow, 1,000 or more unindexed files, or disk at 85% or more. | Cluster red, unavailable, 10,000 or more unindexed files, or disk at 90% or more. |
| Redis (cache) | Infrastructure | Ping (main), Redis mode, Running | Response under 100 ms. | Response of 100 ms or more. | Response of 500 ms or more, or Redis is unavailable. |
| Host resources | Infrastructure | CPU load (main), Memory used, Memory total, Disk used, Disk free, Disk total | CPU, memory and disk all under 85%. | CPU, memory or disk at 85% or more. | CPU, memory or disk at 95% or more. |
| Tika (text extraction) | Services | Latency (main), Running | The service responds. | – | The service does not respond within 5 seconds. |
| LibreOffice (conversion) | Services | Available | The document conversion program is installed. | The program was not found; PDF conversions and printing will not work. | – |
| Services | Verified (main), Enabled, Transport, SMTP | The connection to the mail server is verified. For transport via Microsoft Graph or sendmail, the connection is not verified and the status is always OK. | – | Verification of the connection to the SMTP server failed. The message states the server error. | |
| Firebase (push) | Services | Initialized (main), Configured, Credentials Ok | Notifications to the mobile app are configured and the credentials are valid. | – | Firebase could not be started or the credentials are invalid. |
Components that the installation does not use (Elasticsearch, Tika, Firebase without configuration, Redis when the cache is kept in application memory, disabled email) are in Unknown status with the message “… not configured”, “Email disabled” or “In-memory cache mode”. This does not affect how the application works; the overall status just shows Unknown instead of green.
If the Database Activity card reports “Live database activity unavailable”, the TAS database user does not have permission to read live server activity (on Microsoft SQL Server, the VIEW SERVER STATE permission). The Database Activity tab then shows zeros and empty tables.
Database Activity
A live view of queries, transactions and sessions in the database. Useful when the application is slow and you want to find out whether something is blocking the database.
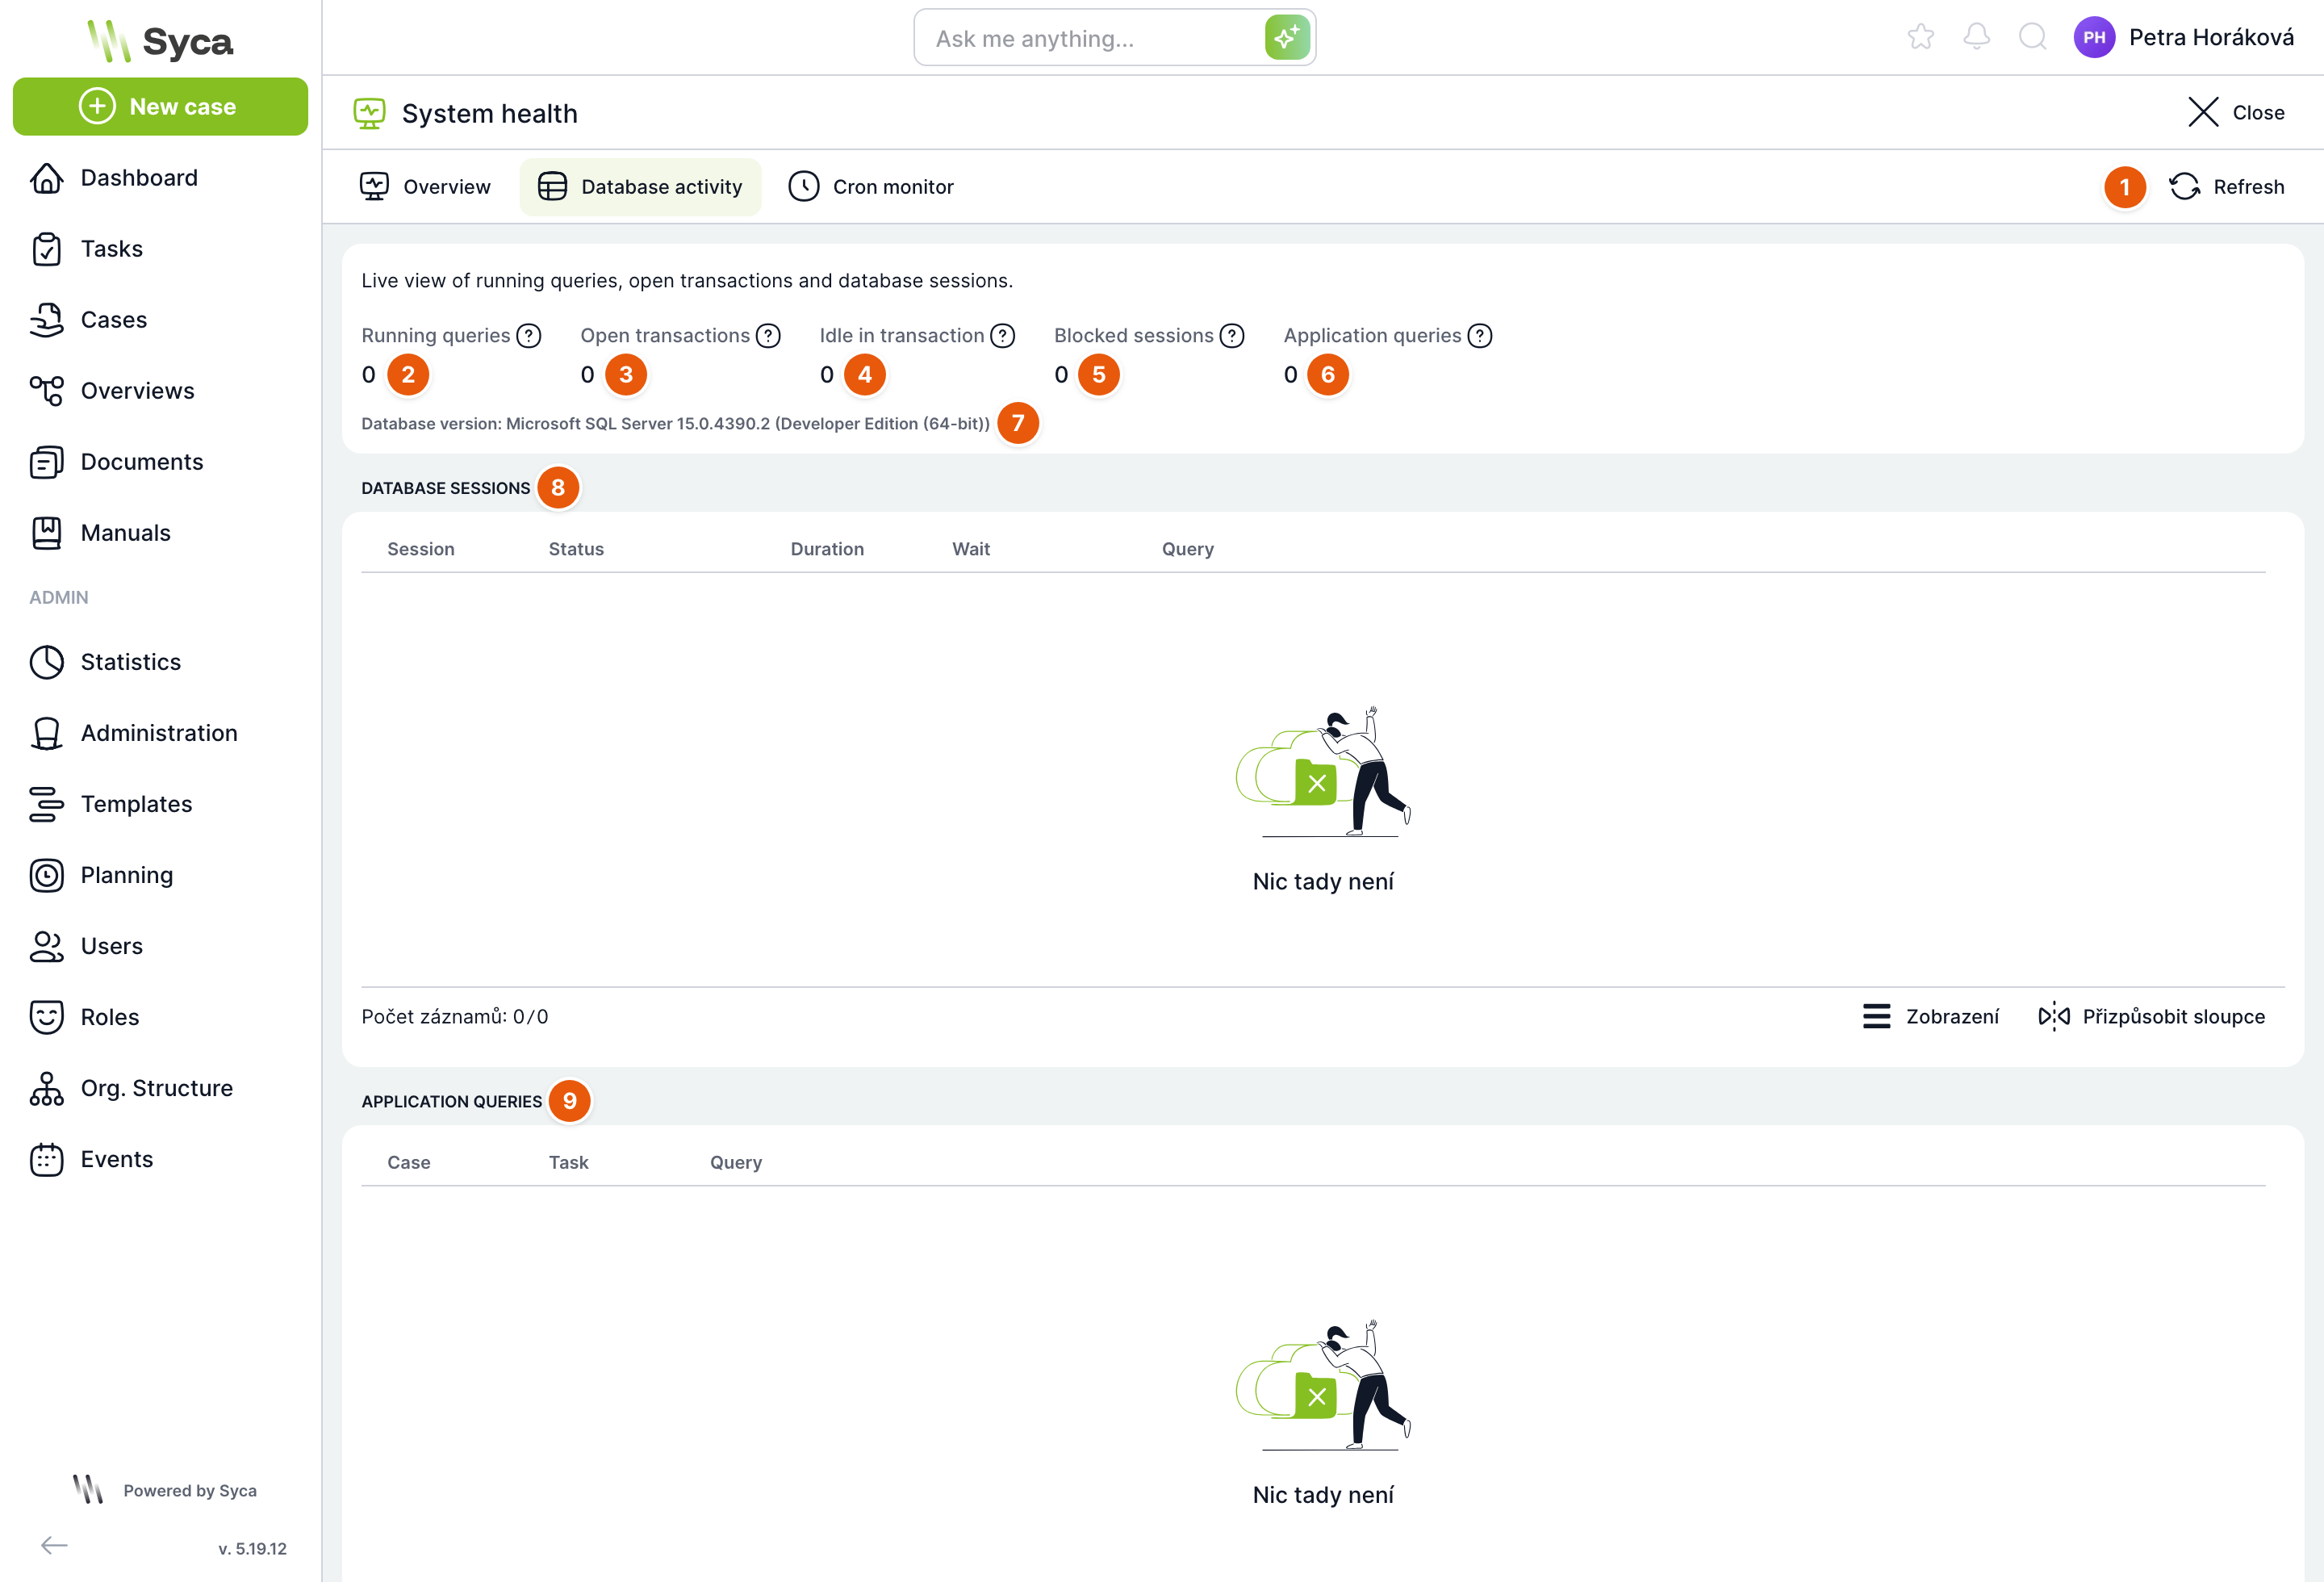
| No. | Element | Purpose |
|---|---|---|
| 1 | Refresh | Loads the data immediately. Otherwise the data refreshes automatically every 10 seconds. |
| 2 | Running queries | Queries the database is currently executing. |
| 3 | Open transactions | Sessions with an open, not yet committed transaction. |
| 4 | Idle in transaction | Sessions that hold an open transaction and are doing nothing. A common source of locks; 0 is normal. |
| 5 | Blocked sessions | Sessions waiting for a lock held by another session. 0 is normal. |
| 6 | Application queries | Number of queries currently running through the application's connection pool. |
| 7 | Database version | Type and version of the database server. |
| 8 | Database sessions | Table of active sessions. |
| 9 | Application queries | Table of queries the application is currently sending. |
The same explanation is available for each number when you hover over the question mark.
Database sessions
| Column | Purpose |
|---|---|
| Session | Session ID in the database. |
| Status | Session status. A blocked session has a red Blocked label with the ID of the blocking session in parentheses. |
| Duration | How long the current query has been running, in seconds. |
| Wait | What the session is waiting for, if it is waiting. |
| Query | SQL query text. |
| Terminate action | Terminates the database session. Asks for confirmation first. Use only when the session is demonstrably blocking others. |
Application queries
| Column | Purpose |
|---|---|
| Case | ID of the case the query is running for, if it can be determined. |
| Task | ID of the task the query is running for, if it can be determined. |
| Query | SQL query text. |
| Cancel action | Cancels the running query. Asks for confirmation first. |
A terminated session or cancelled query interrupts the operation in progress, for example saving a task. The user then gets an error and has to repeat the operation. Do this only for long-hanging queries that block others.
Cron Monitor
An overview of scheduled jobs (crons), their recent runs and their status shown as a traffic light. The same monitor is also available in the Crons tool.
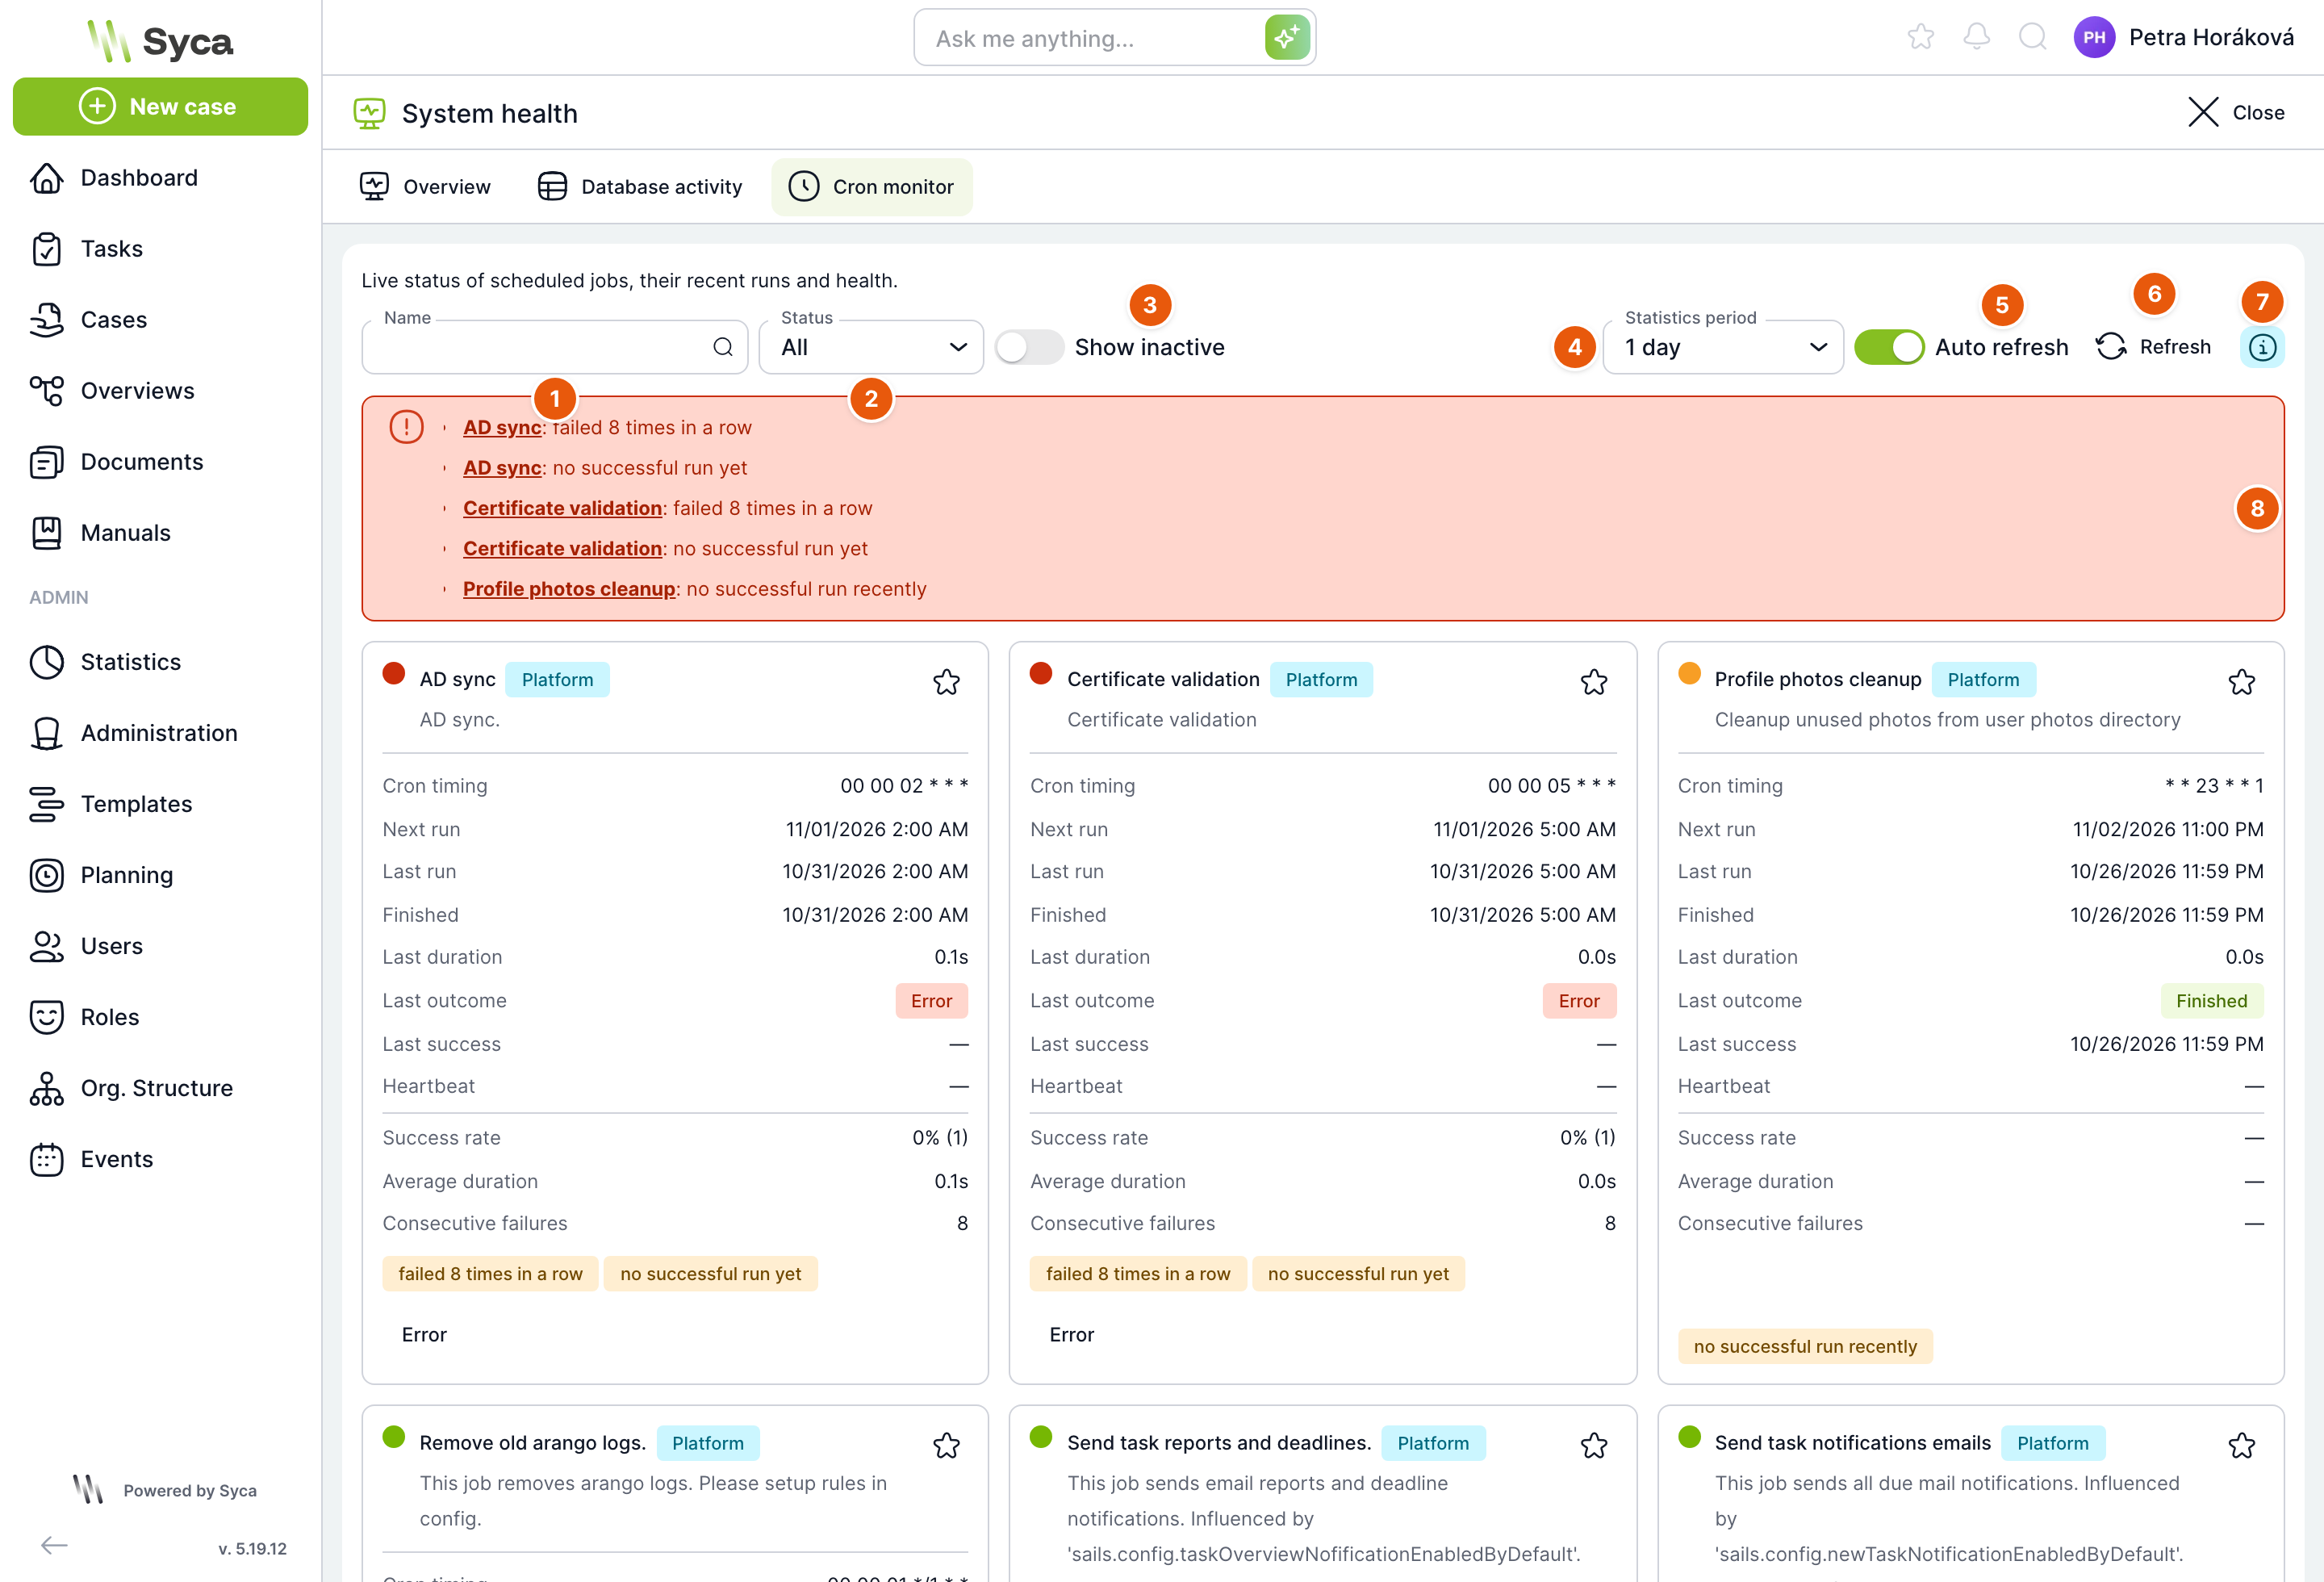
| No. | Element | Purpose |
|---|---|---|
| 1 | Name | Filters crons by name. |
| 2 | Status | Shows only crons in the given status: All, Error (red), Warning (yellow), OK (green). |
| 3 | Show inactive | Also shows disabled crons. They are hidden by default. |
| 4 | Statistics period | The period for which success rate and average duration are calculated: 1 hour, 8 hours, 1 day (default), 3 days, 1 week or All. |
| 5 | Auto refresh | Refreshes the data every 10 seconds. |
| 6 | Refresh | Loads the data immediately. |
| 7 | Indicator help | Opens a window explaining all the information on the cron cards. |
| 8 | Summary | A green OK message, or a red list of problems. Click an underlined cron name to filter for it. |
Cards are sorted from red through yellow to green; favourite crons always come first. Double-click a card to open the logs of that cron.
Cron card
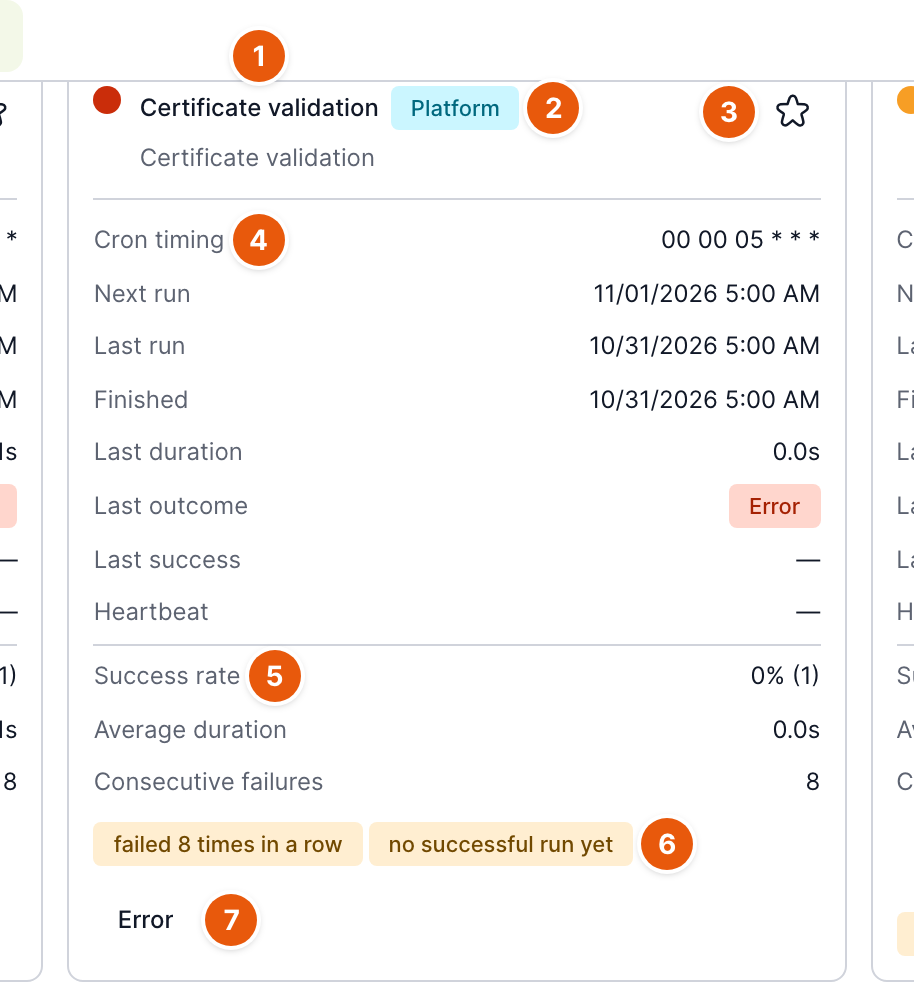
| No. | Element | Purpose |
|---|---|---|
| 1 | Traffic light and name | A coloured dot with the cron status, the name and a description below it. |
| 2 | Type | Platform for a built-in cron, Plugin for a cron from an installed plugin. When the cron is currently running, a Running label is added. |
| 3 | Star | Adds the cron to favourites. Favourite crons are sorted to the top. |
| 4 | Run details | Cron timing (cron expression), Next run, Last run, Finished (end of the last run), Last duration, Last result (Finished, Error, Running or Killed), Last success and Heartbeat (when the worker last reported that the cron is alive). |
| 5 | Period statistics | Success rate (share of successful runs, with the number of runs in parentheses), Average duration and Consecutive failures. For a running cron also Running since, Running and Instance (worker and process ID). |
| 6 | Reasons | Short English reasons why the cron is yellow or red. |
| 7 | Error | Expands the error text of the last run. Click Close to hide it again. |
When a cron is yellow or red
| Reason | Colour | When it occurs |
|---|---|---|
| failed N times in a row | red | The cron has failed as many times in a row as the configured threshold. The default threshold is 5, and when it is reached a notification email is also sent. The threshold is set by whoever installed TAS, using the variable TAS_CRONS_CONSECUTIVE_FAILURE_THRESHOLD. |
| last run failed | yellow | The last run ended with an error, but the failure threshold has not yet been reached. |
| no successful run yet | yellow | The cron ran in the selected period but has never finished successfully. |
| no successful run recently | yellow | More than three run intervals have passed since the last success. |
| overdue – scheduled run did not start | yellow | A scheduled run did not start on time. The tolerance is half the interval, at most 5 minutes. |
| running much longer than usual | yellow | A running cron has taken longer than three times its average duration and also longer than one minute. |
Disabled crons are not evaluated. A cron that has never run is not reported as overdue.
Related: Crons, Logs, Administration menu