Reports and Charts
Reports display data from overviews as charts: bar, pie, line and scatter. Any user can create a chart and share it with others. To open reports, select Statistics in the side menu.
In the default menu, all users see Statistics. An administrator can hide it entirely (configuration
tas.buttons.hideReports) or, in a custom menu setup, make it visible to administrators only. This is the case on the demo installation: only users with the $Administrator or $SuperAdministrator role see the item. If someone has shared a chart with you, you can open it from its link even without the menu item.Statistics page
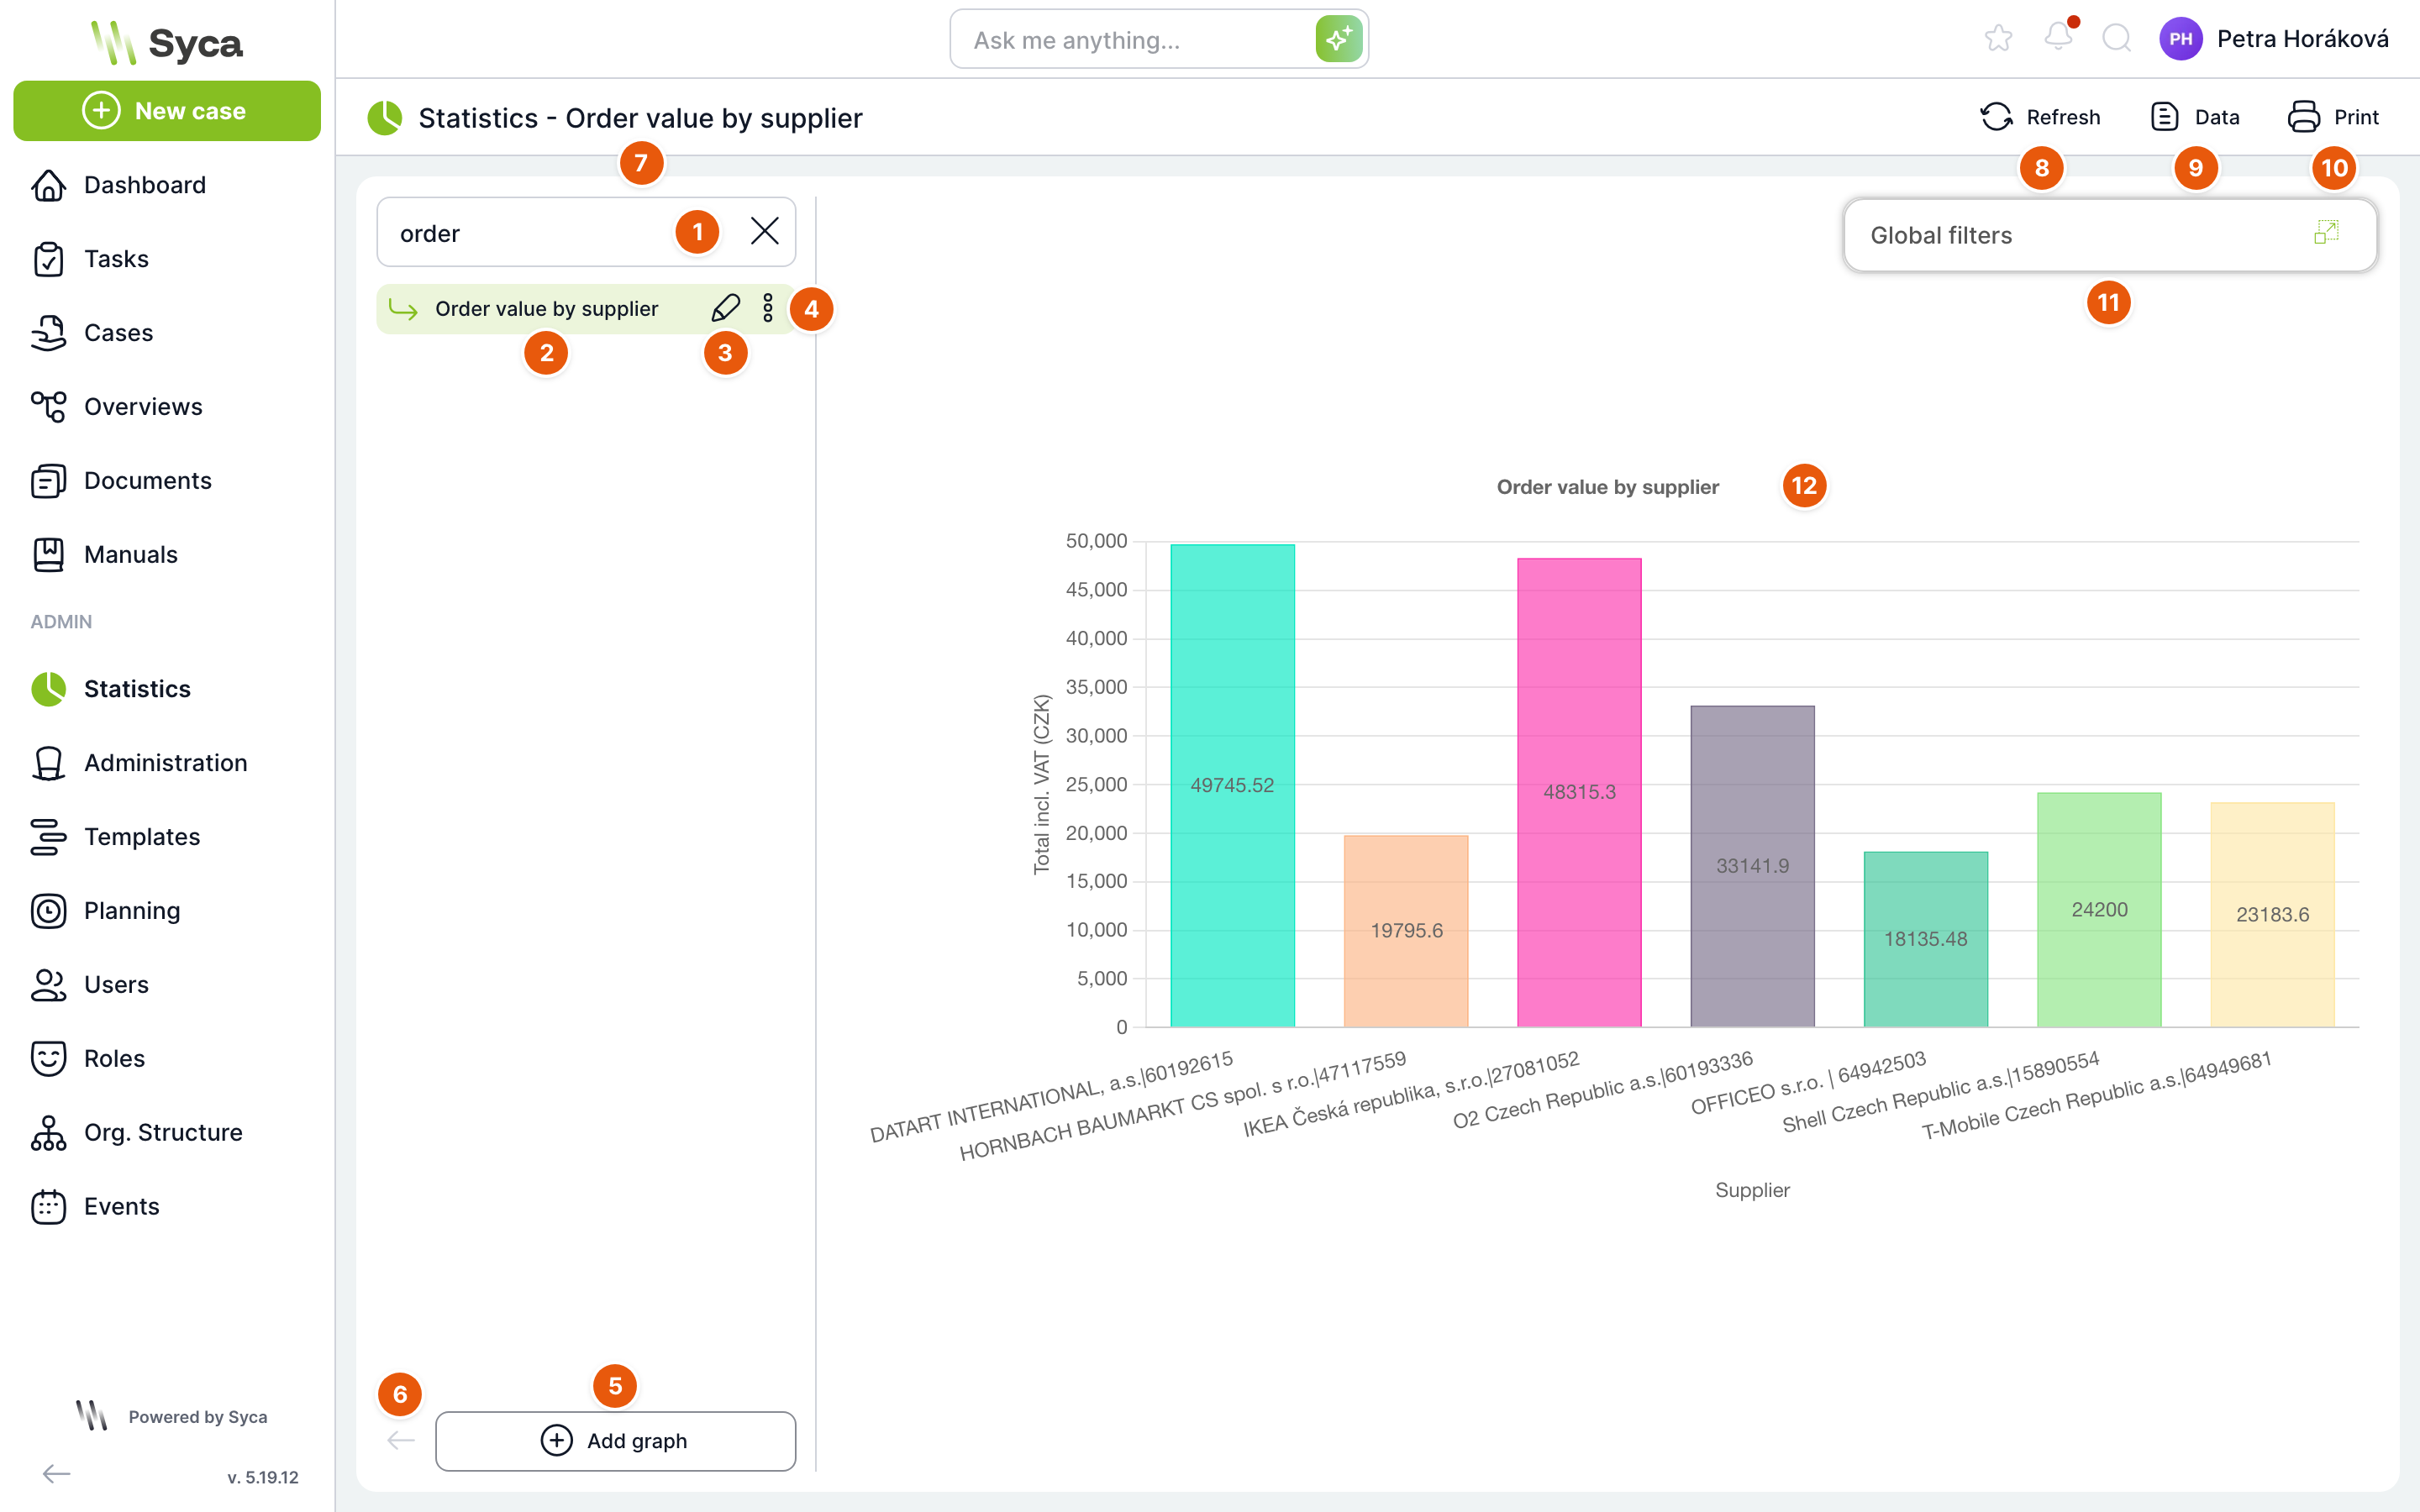
| No. | Element | Purpose |
|---|---|---|
| 1 | Search | Filters the list of charts by name. |
| 2 | Chart in the list | Click to display the chart. The list contains your charts and charts shared with you, sorted alphabetically. If the address does not point to a specific chart, the first one opens. |
| 3 | Pencil | Opens the chart settings. Active only for your own charts. |
| 4 | Three dots | Chart menu: Copy and Delete. |
| 5 | Add chart | Creates a new chart. |
| 6 | Collapse list | Hides the panel with the list of charts. |
| 7 | Title | Statistics and the name of the displayed chart. |
| 8 | Refresh | Reloads the chart data. |
| 9 | Data | Shows the chart values in a table. |
| 10 | Prints the chart, or saves it as a document to a case. | |
| 11 | Global filters | Panel with filters that change the chart data. Shown only for charts that have a global filter. You can move the panel and collapse it with the icon on the right. |
| 12 | Chart | The chart itself. If Show values is enabled, the values are displayed directly in the bars. |
Chart menu
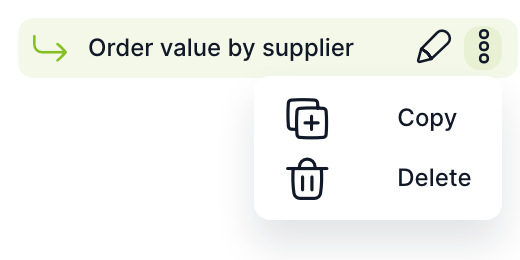
| Item | Purpose |
|---|---|
| Copy | After confirmation, creates a copy of the chart named “clone(n)_name” and opens its settings. You are the owner of the copy. The copy also takes over the sharing. You can also copy charts shared with you. |
| Delete | After confirmation, deletes the chart. You can delete only your own chart. |
Data and printing
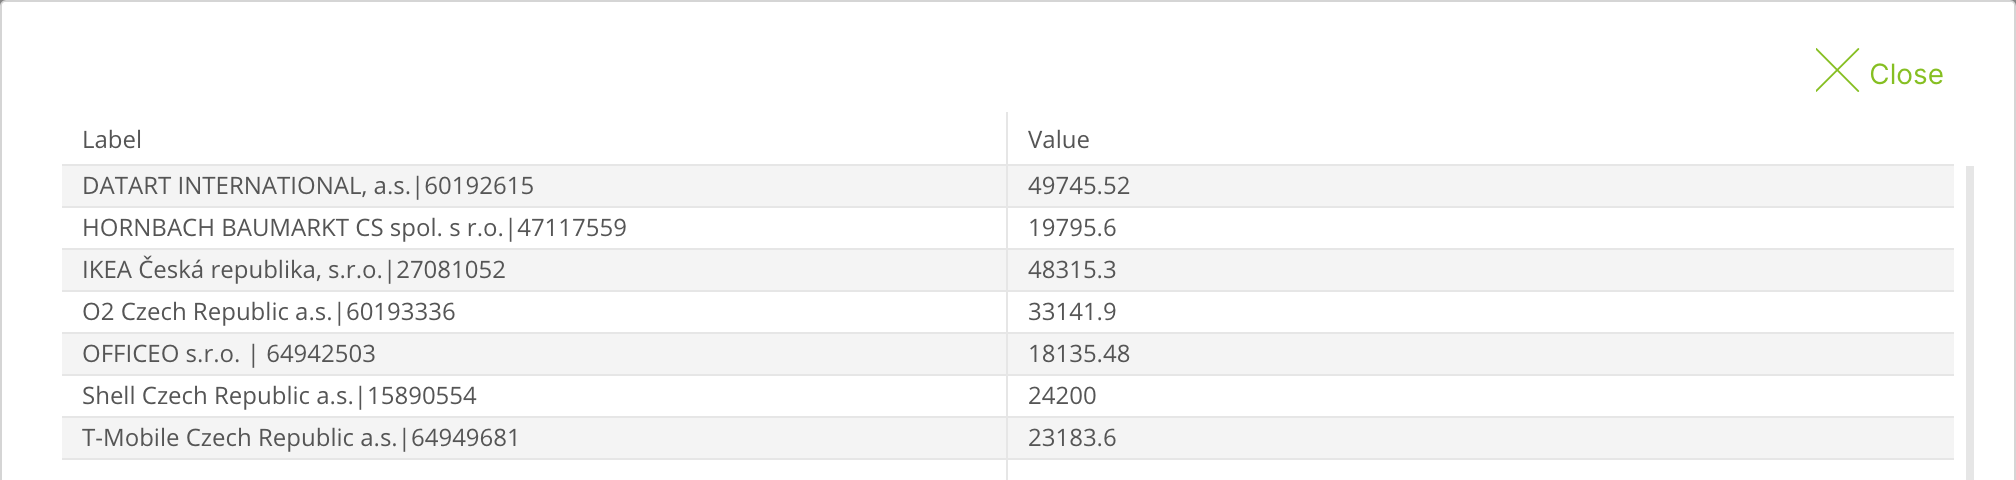
The Data button opens a table with the chart values: the Label and Value columns, and for a chart with groups also Group. Empty values are marked as Not filled.
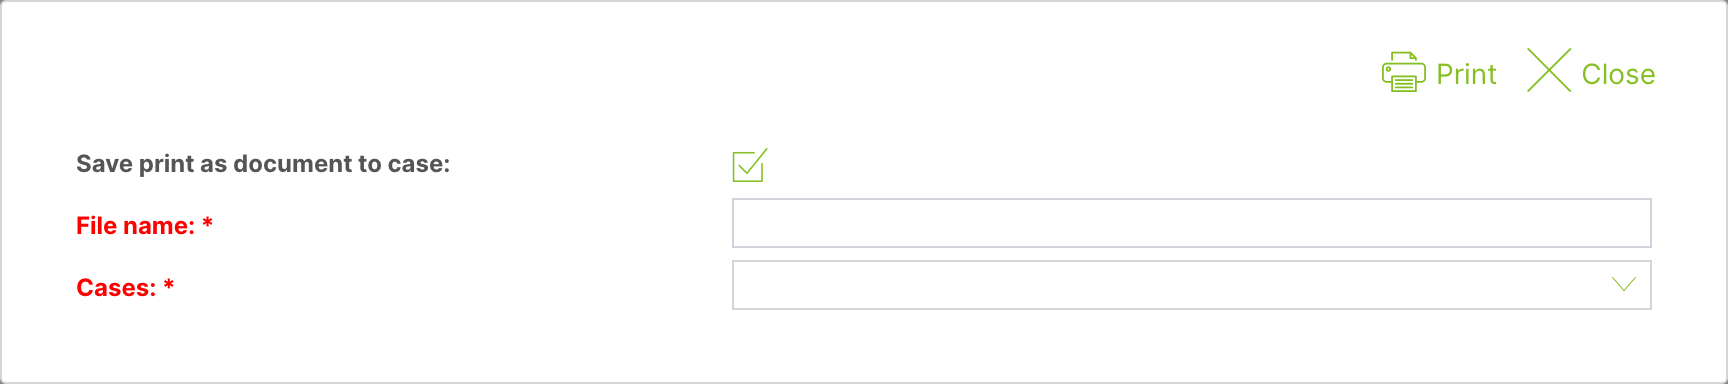
The Print button opens the print dialog. Printing opens the chart as an image in a new browser window.
| Field | Purpose |
|---|---|
| Save print as case document | When checked, the chart image is also saved as a document (PNG) to the selected case. |
| File name | Name of the saved document. Required when saving to a case. |
| Cases | The case the document is saved to. Offers cases from the overview the chart is based on. Required when saving to a case. |
| Prints the chart (and saves the document, if selected). | |
| Close | Closes the dialog. |
Global filters
If a chart has global filters, the Global filters panel appears in the top right. In each filter, you select an option and the chart is immediately recalculated from the matching cases only. The selection applies only to you and only until you leave the page.
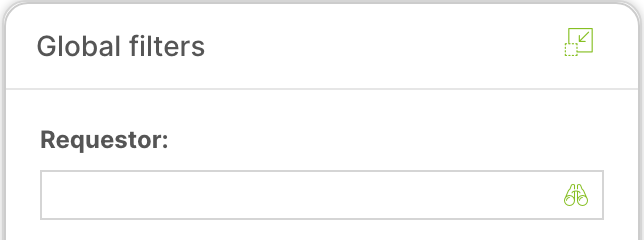
Chart settings
Open the settings with the Add chart button or with the pencil next to your chart. The page has the Chart, Sharing and Global filters tabs.
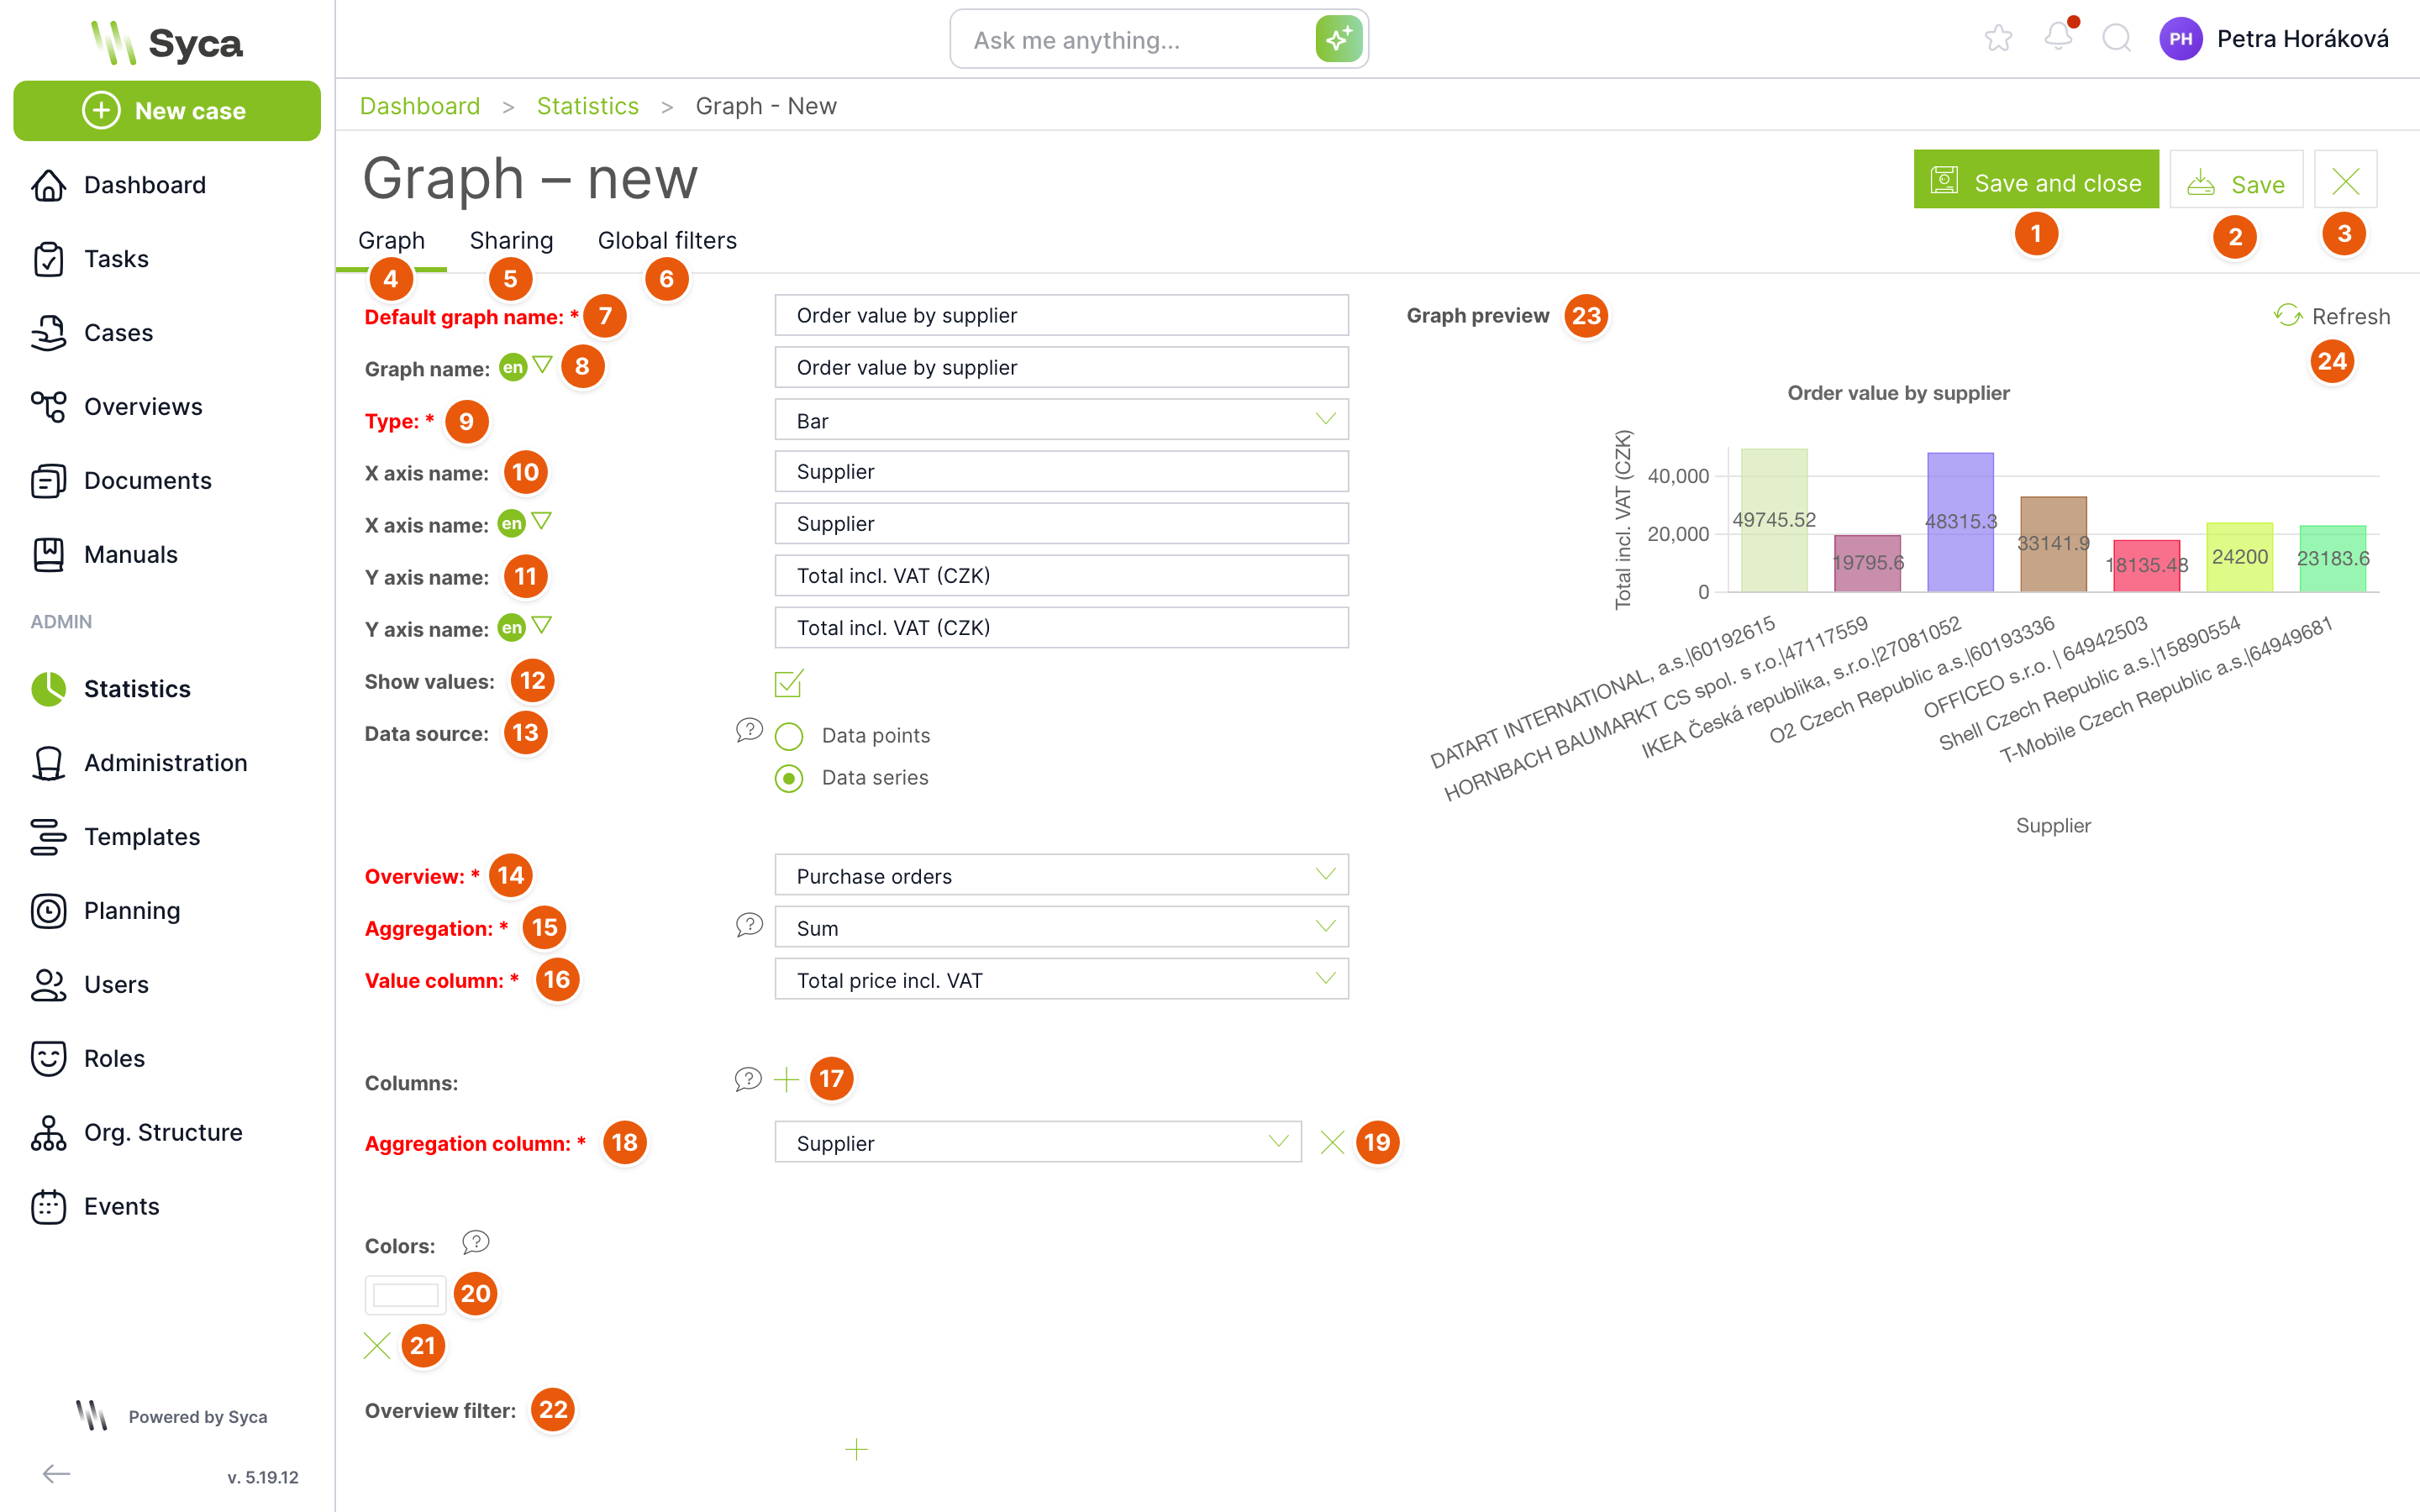
| No. | Element | Purpose |
|---|---|---|
| 1 | Save and close | Saves the chart and returns you to the Statistics page with this chart. |
| 2 | Save | Saves the chart and keeps the settings open. |
| 3 | Cross | Closes the settings without saving. If you have unsaved changes, TAS asks whether to save them. |
| 4 | Chart | Tab with the chart settings. |
| 5 | Sharing | Sharing tab. Shown when overview sharing is enabled (default) or when you are an administrator. |
| 6 | Global filters | Global filters tab. Shown only for the Datasets data source. |
| 7 | Default chart name | Chart name. Required. Must be unique among the charts of all users. |
| 8 | Chart name | Name in other languages. Switch the language with the arrow next to the language label. |
| 9 | Type | Pie, Line, Scatter, Bar, or Bar – groups. Required. |
| 10 | X axis name | Label of the horizontal axis, also in other languages. Not available for a pie chart. |
| 11 | Y axis name | Label of the vertical axis, also in other languages. Not available for a pie chart. |
| 12 | Show values | Displays the values directly in the chart. Enabled automatically for the Bar – groups type. |
| 13 | Data source | Data points: you enter each chart point separately. Datasets: points are created automatically from the selected column. Not available for the Bar – groups type. |
| 14 | Overview | The overview the chart takes its data from. Required. Offers the overviews you can see. |
| 15 | Aggregation | How the values are calculated: Count, Average, Sum, Minimum, Maximum. Required. |
| 16 | Value column | Numeric column used for the calculation. Required, except for the Count aggregation. Offers only numeric variables. |
| 17 | Plus next to Columns | Adds a column by which cases are grouped. |
| 18 | Aggregation column | Column whose values form the chart points (supplier in the image). Required. For a date column, you select the Time dimension: day of month, day of week, week, month or year. |
| 19 | Cross next to the column | Deletes the aggregation column. |
| 20 | Colors | Bar colors. TAS generates missing colors automatically, never dark or too light ones. |
| 21 | Cross next to a color | Deletes the color. |
| 22 | Overview filter | Additional conditions that narrow the overview data for this chart only. |
| 23 | Chart preview | How the chart will look. |
| 24 | Refresh | Redraws the preview according to the current settings. |
In the Czech version 5.19, the second data source option is not translated and is displayed as “Datasets”.
Data points data source
With the Data points option, you enter each chart point separately using the plus button next to Chart points. Each point has these fields:
| Field | Purpose |
|---|---|
| Overview | The overview the point draws from. Required. Each point can have a different overview. |
| Name | Point label, also in other languages. Required. |
| Color | Point color. |
| Aggregation | Count, Average, Sum, Minimum, Maximum. Required. |
| Column | Numeric column. Required, except for the Count aggregation. |
| Filter | Conditions for this point only. You can use dynamic values, for example Today, Start of month or User. |
Use the icons next to a point to copy or delete it. For line, scatter and bar charts with data points, you can set the Sorting of points by value: Ascending, Descending, No sorting.
Bar – groups type
This type displays the overview values directly, without aggregation. Fill in Overview, X axis – data and Y axis – values (required), and optionally X axis – groups and Y axis – colors. The optional X axis – global filter field adds a switch with the values of the selected column to the Statistics page.
Sharing
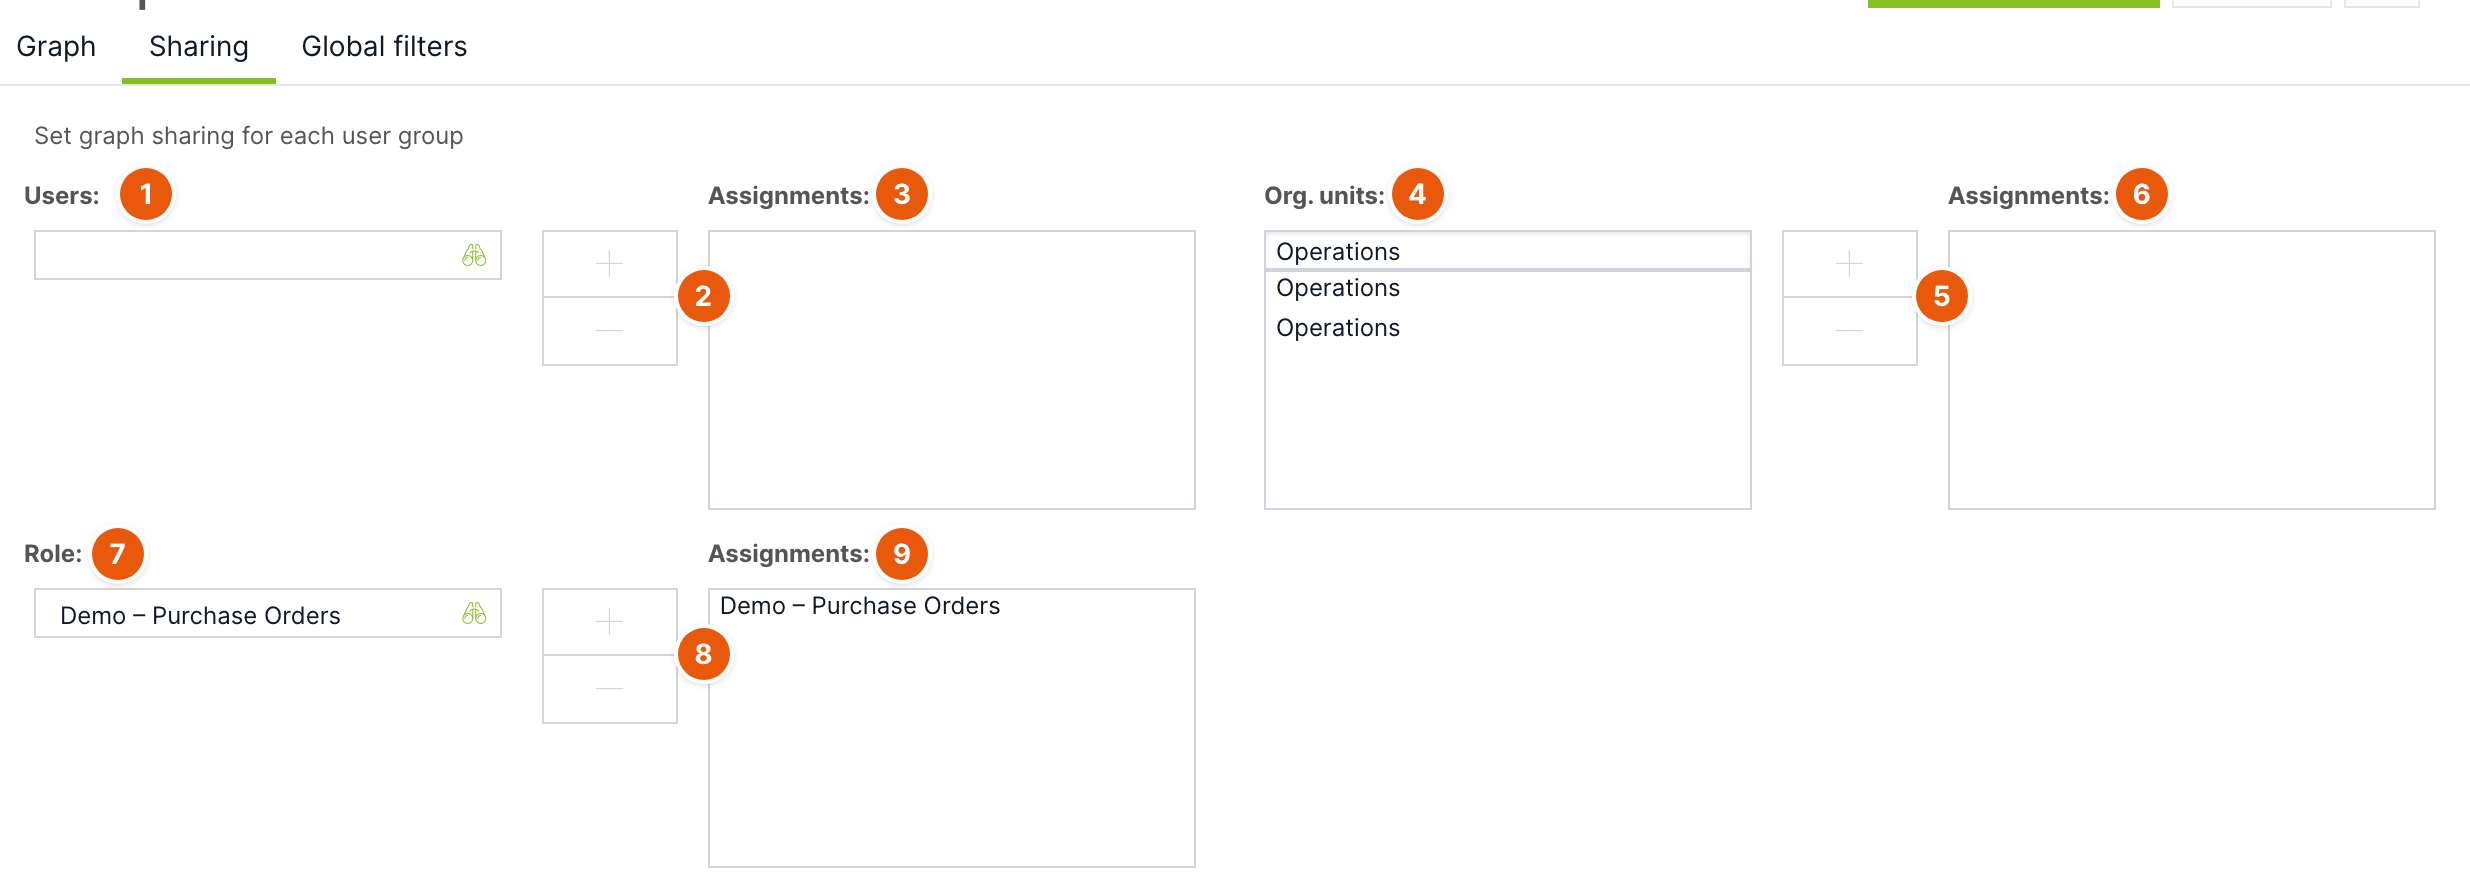
| No. | Element | Purpose |
|---|---|---|
| 1 | Users | Searches for the user you want to share the chart with. |
| 2 | Plus and minus | Adds the selected item to the assignment or removes it from the assignment. |
| 3 | Assignment | Users who will see the chart. |
| 4 | Org. units | List of units with search. People from subordinate units will also see the chart. |
| 5 | Plus and minus | Adds or removes a unit. |
| 6 | Assignment | Units that will see the chart. |
| 7 | Roles | Searches for a role. |
| 8 | Plus and minus | Adds or removes a role. |
| 9 | Assignment | Roles whose holders will see the chart. |
Sharing grants only the right to view, print and copy the chart. Only the owner can edit or delete it.
The chart is calculated from the overview, and the overview shows only the cases the viewing user has rights to. Two people may therefore see different numbers in the same chart.
Global filters
This tab is available only for charts with the Datasets data source. Here you set up filters that chart users then switch in the Global filters panel.

| No. | Element | Purpose |
|---|---|---|
| 1 | Arrows | Change the order of filters. |
| 2 | Pencil | Edits the filter. |
| 3 | Cross | Deletes the filter. |
| 4 | Add filter | Opens the new filter dialog. |
| 5 | Dynamically from variable | For a dynamic filter, the variable the options are taken from. |
| 6 | Default option | The option preselected when a user opens the chart. |
New filter dialog:
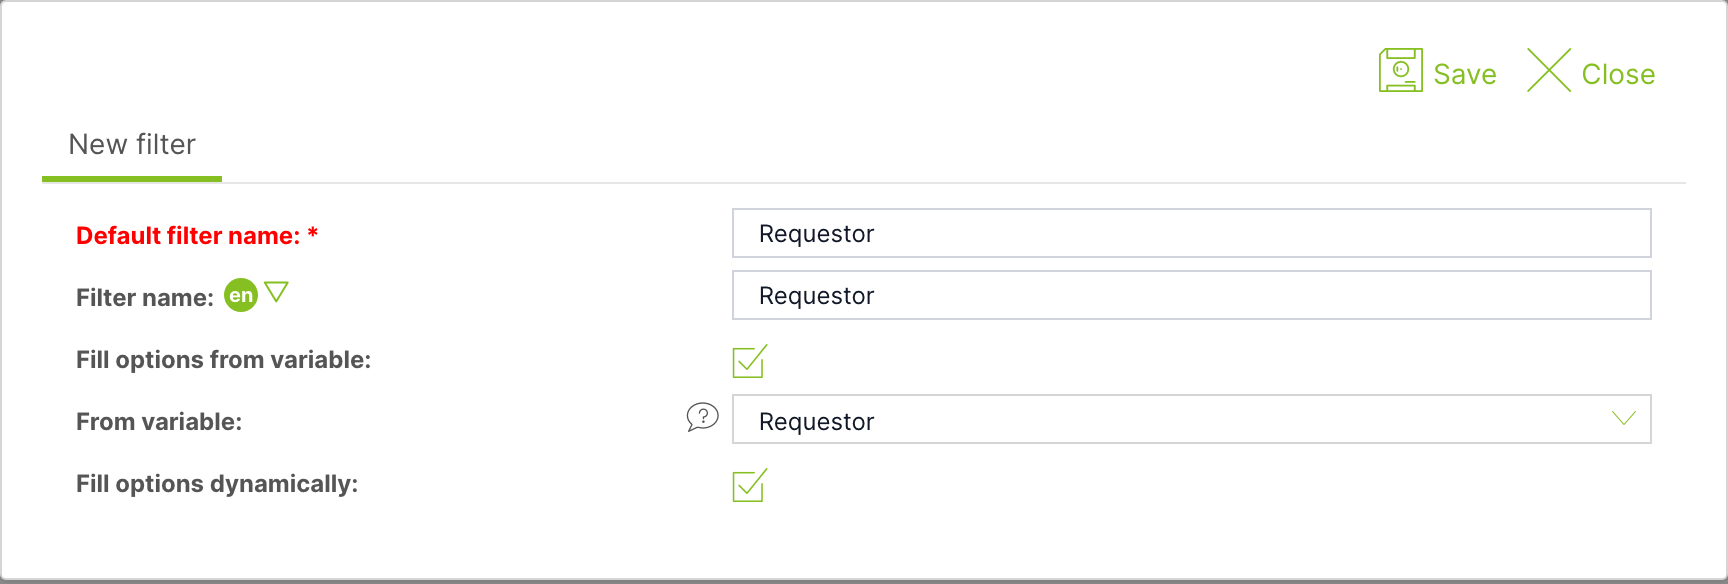
| No. | Field | Purpose |
|---|---|---|
| 1 | Default filter name | Filter name in the panel. Required. |
| 2 | Filter name | Name in other languages. |
| 3 | Fill options from variable | The filter options are created from the values of a variable. Only variables of type DT, DL, LT, LD, LN and D without multiple selection can be used. |
| 4 | From variable | The variable the options are taken from. For a date variable, you select the Time dimension. |
| 5 | Fill options dynamically | The options are loaded from the current values of the variable each time the chart is displayed. If unchecked, you select a fixed list of options in the Values field. |
| 6 | Save | Adds the filter to the list. The chart then still needs to be saved. |
| 7 | Close | Closes the dialog without adding the filter. |
For a filter without a variable, you define each option yourself: it has a name and its own condition (Filter). Add options with the Add option button and change their order with the arrows.
How to create the “Order value by supplier” chart
- On the Statistics page, click Add chart.
- Fill in the Default chart name, select the Bar Type and fill in the axis names.
- Check Show values and select Datasets as the Data source.
- Select the Overview with orders, the Sum Aggregation and the Total price Value column.
- Use the plus next to Columns to add the Supplier aggregation column.
- Click Refresh next to the preview and check the chart.
- On the Sharing tab, add the role or colleagues who should see the chart.
- Click Save and close.
Related: Overviews, Creating and editing an overview.